LT-mapper
LT-mapper 把長期建圖拆成三個模組:LT-SLAM 以錨節點(anchor node)多時段位姿圖與 Scan Context 跨時段迴圈,對齊原點不同且各自漂移的時段;LT-removert 先移除高動態點,再以集合差分偵測低動態變化,分為新出現(PD)與消失(ND)的點;LT-map 維護最新狀態的即時地圖與持久結構的 meta map,並可串接差異地圖重建任一時間點的地圖。只需單一光達(IMU 可選)。
本頁內容
LT-mapper chains anchor-node multi-session SLAM with Scan Context loops, dynamic removal plus positive/negative change detection, and a map manager that can reconstruct the map at any session time.
技術屬性
欄位內容為文獻擷取紀錄的原文用語(英文),以原文為據;「未查證」表示本研究尚未讀到該資訊,不代表該方法不具備此能力。
| 感測輸入 | 3D LiDAR、IMU (optional, for initial odometry) |
|---|---|
| 原文測試平台 | not described in the paper: MulRan KAIST and DCC sequences (a vehicle dataset according to its own paper) and the self-collected six-session LT-ParkingLot dataset (carrier not stated) |
| 狀態估計 | multi-session pose-graph optimization with anchor nodes (iSAM2 in GTSAM) |
| 資料關聯 | Scan Context inter-session loop candidates verified by ICP between keyframe submaps (loops accepted only with low ICP fitness score, which also sets an adaptive covariance) with a robust back end, followed by radius-search loops by pose proximity; high-dynamic points removed with Removert; low-dynamic changes found by a kd-tree test of whether a point has k target points within r m; weak negative differences reverted by a modified Removert (Sec. IV-A, IV-B) |
| 時間表示 | discrete poses (keyframes) |
| 去畸變 | 原文未報告 (delegated to input odometry, e.g., LIO-SAM) |
| 迴圈閉合 | Scan Context intra- and inter-session loops |
| 全域最佳化 | joint multi-session pose graph with per-session anchor nodes |
| 地圖表示 | keyframe point clouds; live map and meta map; delta maps of positive and negative changes |
| 先驗資訊 | previous sessions (central map); no initial inter-session alignment required |
| 可輸出幾何 | aligned multi-session point clouds, static maps, positive/negative change point sets, maps at any timestamp via change composition |
| 計算需求 | Offline modular C++ commands (ltslam, ltremovert, ltmap); hardware not reported. Change composition takes about 0.05 s per keyframe; for KAIST 04 versus 01, delta-map chaining took 9.8 s versus 87.0 s (without HD removal) or 160.0 s (with HD removal) when computing changes from scratch, and merged-map memory was 85.7 MB versus 213.6 MB for whole snapshots (Sec. V-D, Table II). |
使用設備
原文使用的感測器、運算硬體與載具(equipment)。型號保留原文寫法,連結到設備頁中同一型號的歸併名稱;角色依原文用途分為方法輸入、資料集感測器、執行運算平台、參考或真值量測(reference or ground truth)與比較對象設備。
| 類別 | 型號(原文寫法) | 角色 | 資料集 | 原文規格 | 出處 |
|---|---|---|---|---|---|
| LiDAR | single 3D LiDAR (model not named) | 方法輸入 | MulRan KAIST and DCC; LT-ParkingLot (six sessions over three days) | 原文未報告 | (Kim & Kim, 2022, Sec. III; Sec. V-A2) |
| 慣性量測單元(IMU) | IMU (optional, for initial odometry; model not named) | 方法輸入 | 未標示 | 原文未報告 | (Kim & Kim, 2022, Sec. III) |
論文圖片
只收錄原文以開放授權(open license)釋出的圖片,並依授權條件標示出處、圖號、授權與修改方式。
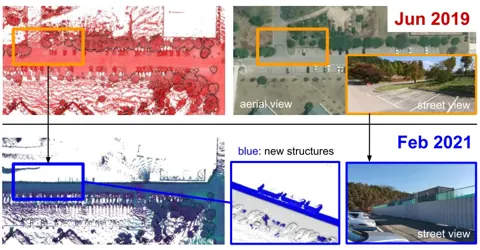
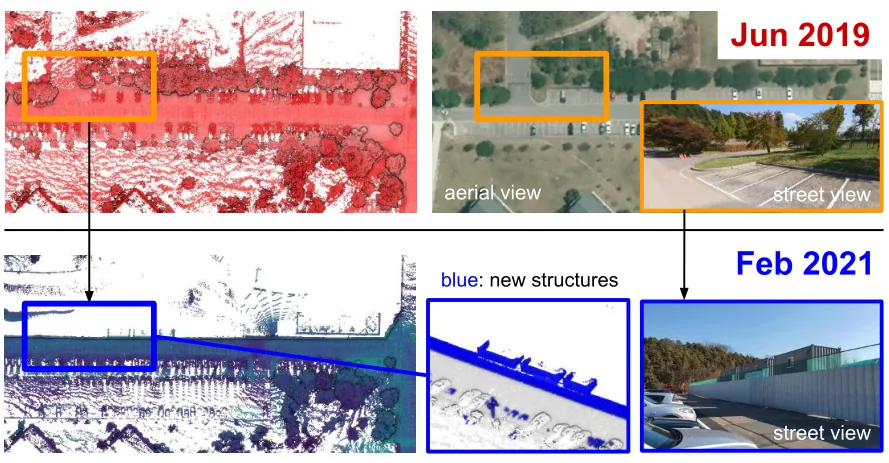
Fig. 1MulRan KAIST 01(2019 年 6 月)與 KAIST 04(2021 年 2 月)約 1.5 年間的永久結構變化,出現施工圍牆,停車格與樹木消失,藍點為偵測到的變化點
出處:Kim & Kim, 2022,Fig. 1。授權:CC BY 4.0 (arXiv 2107.07712v1 licence); ICRA 2022 version of record © IEEE。原始圖檔。修改:轉存為 WebP 格式。
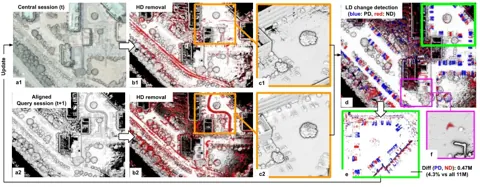
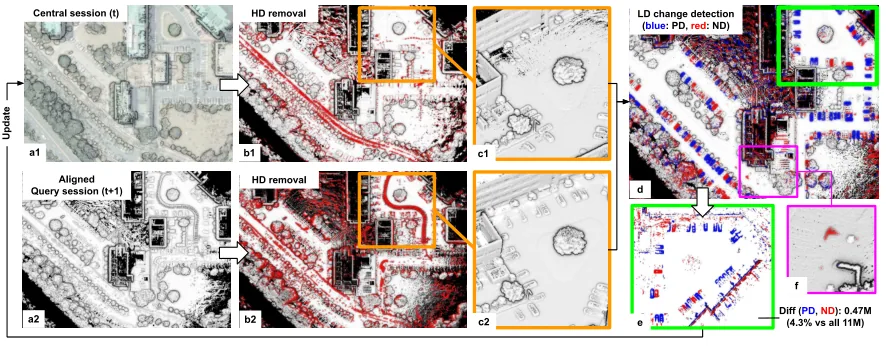
Fig. 5LT-removert 流程:接收對齊的中央與查詢地圖,移除高動態點,偵測新增與消失的低動態變化,並跨時段刪除殘留動態點
出處:Kim & Kim, 2022,Fig. 5。授權:CC BY 4.0 (arXiv 2107.07712v1 licence); ICRA 2022 version of record © IEEE。原始圖檔。修改:轉存為 WebP 格式。
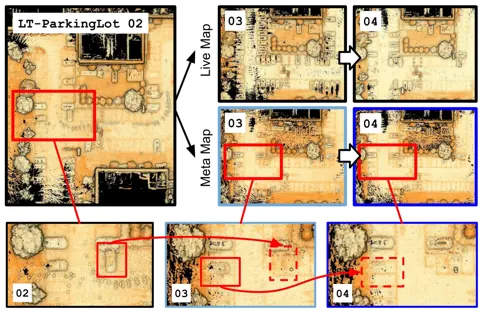
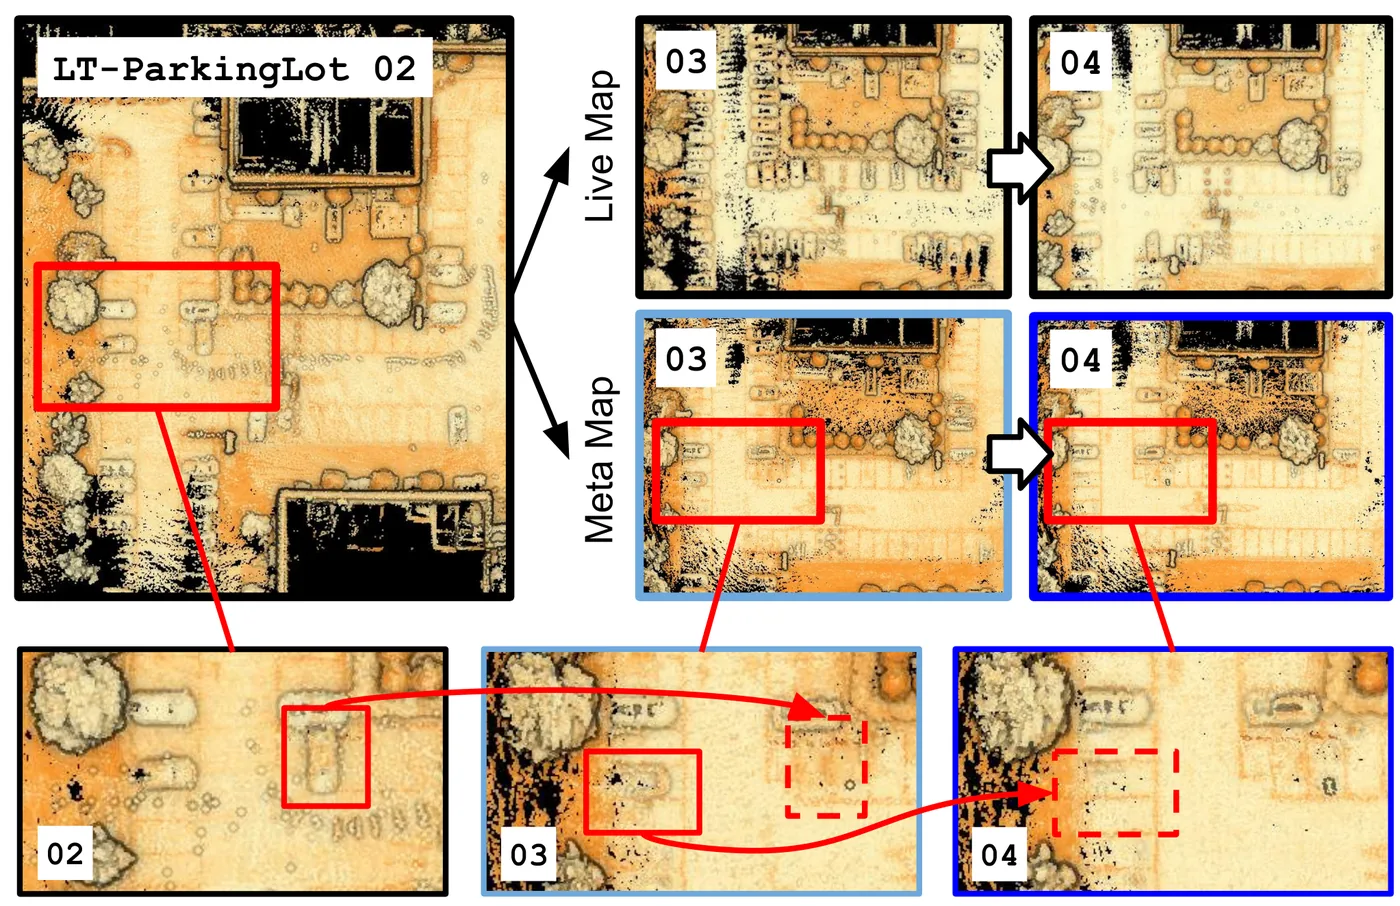
Fig. 9LT-mapper 的兩種地圖管理:保持最新狀態的即時地圖,與逐次移除非體積最大化點、保留持久結構的 meta map
出處:Kim & Kim, 2022,Fig. 9。授權:CC BY 4.0 (arXiv 2107.07712v1 licence); ICRA 2022 version of record © IEEE。原始圖檔。修改:縮小至寬度不超過 1400 px,並轉存為 WebP 格式。

Fig. 10以差異地圖串接進行變化合成:由 KAIST 04 回溯還原 KAIST 01,未對應的牆面消失、原有牆面復原
出處:Kim & Kim, 2022,Fig. 10。授權:CC BY 4.0 (arXiv 2107.07712v1 licence); ICRA 2022 version of record © IEEE。原始圖檔。修改:縮小至寬度不超過 1400 px,並轉存為 WebP 格式。

作者報告的優勢與限制
優勢
- No good initial alignment between sessions required (abstract; Sec. IV)
- Inter-session loops reduced each session's internal drift, evaluated with the RPG trajectory tool (Sec. V-B, Fig. 8)
- Tested with temporal gaps from days to a year (abstract)
限制
- Found in follow-up work: LT-SLAM failed on a repetitive indoor parking dataset because Scan Context could not recognize loops (Yang et al., 2024 Sec. IV-B)
- (inference) Change detection inherits Removert's visibility assumptions and any residual inter-session misalignment
- No point-wise ground truth for changes; change detection is assessed only implicitly by composing changes and comparing restored and real maps with patch-wise Chamfer distance (Sec. V-D, Table I)
- The authors show that even RTK-GPS ground-truth maps of MulRan DCC 01 and 02 are not globally consistent across sessions (Fig. 2a)
- Inter-session loop detection relies on Scan Context plus ICP fitness; false loops are left to a robust back end (Sec. IV-A)
營建工程相關證據
未於工地測試(MulRan 都市與校園、停車場六時段)。作者的長期變化示例中,MulRan KAIST 01 與 04(約 1.5 年間隔)出現新設施工圍牆、DCC 01/02 有施工圍牆遮蔽後移除(Fig. 1、Fig. 6),屬都市場景中的施工相關變化,而非工地內部監測。其跨時段對齊與正、負變化偵測流程,與工地重複掃描做進度與差異比對的需求結構相同(推論);BIM-SLAM 直接沿用 LT-SLAM(Vega Torres et al., 2023 Sec. 4.3)。
原文驗證環境:公開基準、跨場域
報告的性能數據
以下是原文作者報告的性能數值(author-reported results),不是本研究重新量測的結果。每張圖只並列同一個比較組(comparison group,同一張表、同一組實驗設定)內的方法;不同比較組之間的數值不可直接比較,也不構成排名。
本方法共出現在 4 個比較組,合計 15 筆紀錄。
Kim & Kim, 2022 · Table I 本方法 7 筆
資料集與序列MulRan · KAIST 01 and 04 (about 1.5-year gap)
表格設定(擷取紀錄原文):Change composition check on MulRan KAIST: KAIST 01 restored from KAIST 04 by chaining delta maps (01 to 02 and 02 to 04) compared with the real KAIST 01 (positive pair) and KAIST 04 compared with 01 (negative pair); aligned maps split into 5 m cubic patches with at least 25 points; for 100 KF01s and near 200 KF04s (Kim & Kim, 2022, Table I)
Chamfer Distance Max,MulRan · KAIST 01 and 04 (about 1.5-year gap)
只並列這張表在相同設定下報告的方法;以「本方法:」開頭者為本頁方法。失敗、未執行與未報告以標記呈現,不是 0。
按 Tab 進入圖表後,用上下方向鍵逐一瀏覽各類別,Esc 關閉提示框;也可開啟表格檢視閱讀全部數值。
這些是 Kim & Kim, 2022 在此表設定下報告的數值(author-reported results),只能在同一個比較組內對照,不代表方法在其他資料或設定下的表現。
資料來源作者報告值(Kim & Kim, 2022, Table I)
| 方法(原文寫法) | 報告值 | 出處 |
|---|---|---|
| Pos. Pair (01 vs Restored 01)本方法原文提出 | 6.41 | (Kim & Kim, 2022, Table I) |
| Neg. Pair (01 vs 04) | 29.22 | (Kim & Kim, 2022, Table I) |
Yang et al., 2024 · Table III 本方法 5 筆
指標Chamfer distance after multi-session map alignment
表格設定(擷取紀錄原文):Average Chamfer distance after aligning several session maps into one frame; poses from XGrids proprietary software (XGrid datasets) or SC-LIO-SAM and SC-A-LOAM (LT-ParkingLot, MulRan); outlier threshold tau 0.5; the proposed method also uses Chamfer distance to pick its alignment (Yang et al., 2024, Table III)
Chamfer distance after multi-session map alignment,XGrid-Outdoor · 6 session maps
只並列這張表在相同設定下報告的方法;以「本方法:」開頭者為本頁方法。失敗、未執行與未報告以標記呈現,不是 0。
按 Tab 進入圖表後,用上下方向鍵逐一瀏覽各類別,Esc 關閉提示框;也可開啟表格檢視閱讀全部數值。
這些是 Yang et al., 2024 在此表設定下報告的數值(author-reported results),只能在同一個比較組內對照,不代表方法在其他資料或設定下的表現。
資料來源作者報告值(Yang et al., 2024, Table III)
| 方法(原文寫法) | 報告值 | 出處 |
|---|---|---|
| Ours原文提出 | 0.069 | (Yang et al., 2024, Table III) |
| LT-SLAM本方法 | 0.0862 | (Yang et al., 2024, Table III) |
| ICP | 0.1389 | (Yang et al., 2024, Table III) |
| NDT | 0.1342 | (Yang et al., 2024, Table III) |
Kim & Kim, 2022 · Table II 本方法 2 筆
資料集與序列MulRan · KAIST 01 and 04
表格設定(擷取紀錄原文):Efficiency of LT-map delta-map chaining versus saving whole snapshots for the Fig. 10 scene (KAIST 04 vs 01); hardware not reported (Kim & Kim, 2022, Table II)
Computation Time (between 04 and 01),MulRan · KAIST 01 and 04
只並列這張表在相同設定下報告的方法;以「本方法:」開頭者為本頁方法。失敗、未執行與未報告以標記呈現,不是 0。
按 Tab 進入圖表後,用上下方向鍵逐一瀏覽各類別,Esc 關閉提示框;也可開啟表格檢視閱讀全部數值。
這些是 Kim & Kim, 2022 在此表設定下報告的數值(author-reported results),只能在同一個比較組內對照,不代表方法在其他資料或設定下的表現。
資料來源作者報告值(Kim & Kim, 2022, Table II)
| 方法(原文寫法) | 報告值 | 出處 |
|---|---|---|
| Ours (LT-map, delta map chaining)本方法原文提出 | 9.8 s | (Kim & Kim, 2022, Table II) |
| Baseline, w/o HD removal | 87 s | (Kim & Kim, 2022, Table II) |
| Baseline, w/ HD removal | 160 s | (Kim & Kim, 2022, Table II) |
Yang et al., 2024 · Text Sec. IV-B 本方法 1 筆
指標total alignment time (over 10 min)
資料集與序列XGrid-Outdoor · about 10M points
表格設定(擷取紀錄原文):Time to align XGrid-Outdoor session maps of about 10M points including the full grid search, compared with LT-SLAM keyframe descriptor traversal and graph optimization (Yang et al., 2024, Text Sec. IV-B)
total alignment time (over 10 min),XGrid-Outdoor · about 10M points
這張表在此指標與資料序列只列出本方法一筆,沒有可並列的其他方法,因此不畫圖,數值與出處見下表。這是 Yang et al., 2024 在此表設定下報告的數值(author-reported results),不代表方法在其他資料或設定下的表現。
| 方法(原文寫法) | 報告值 | 出處 |
|---|---|---|
| LT-SLAM本方法 | 10 min僅報告範圍註記(擷取紀錄):lower bound: reported as over 10 min | (Yang et al., 2024, Sec. IV-B) |
來源
Kim & Kim, 2022
(2022)LT-mapper: A Modular Framework for LiDAR-based Lifelong Mapping2022 International Conference on Robotics and Automation (ICRA), pp. 7995-8002
DOI 10.1109/icra46639.2022.9811916arXiv 2107.07712程式碼
同儕審查已出版已讀全文近十年查證後修正
相關版本
- 預印本:arXiv 2107.07712 https://arxiv.org/abs/2107.07712
- 程式碼釋出:gisbi-kim/lt-mapper https://github.com/gisbi-kim/lt-mapper
程式碼:https://github.com/gisbi-kim/lt-mapper(授權:MIT (LICENSE file, copyright year 2025))。有公開程式碼不等於已被重現,也不代表目前版本與論文版本相同。