OverlapNet
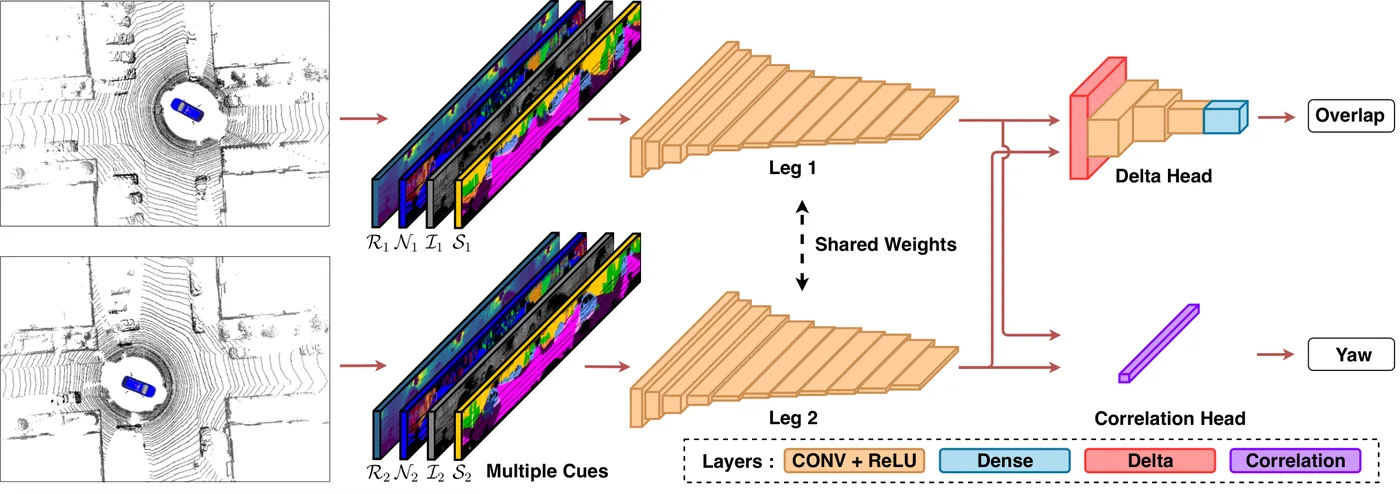
OverlapNet 以孿生網路(siamese network)比較兩次光達掃描,輸入由單次掃描產生的距離影像、法向量、強度與語意機率,輸出兩者的重疊率與相對偏航角。系統以位姿共變異數傳播決定迴圈搜尋範圍,取代 SuMa 原本只取最近幀的啟發式迴圈偵測,並可用預測的偏航角作為 ICP 初值。
本頁內容
OverlapNet learns scan-to-scan overlap and relative yaw from multi-cue range images and uses them, with covariance-bounded search, for loop closing in SuMa.
技術屬性
欄位內容為文獻擷取紀錄的原文用語(英文),以原文為據;「未查證」表示本研究尚未讀到該資訊,不代表該方法不具備此能力。
| 感測輸入 | 3D LiDAR |
|---|---|
| 原文測試平台 | vehicle |
| 狀態估計 | 不適用 (integrated into SuMa surfel SLAM with pose graph) |
| 資料關聯 | learned siamese network on range, normal, intensity and semantic-probability images predicting scan overlap and relative yaw |
| 時間表示 | 不適用 |
| 去畸變 | 原文未報告 |
| 迴圈閉合 | overlap-based candidate detection within a covariance-propagated search region, replacing SuMa's nearest-frame heuristic; yaw estimate can initialize ICP |
| 全域最佳化 | via host SLAM (SuMa) pose graph |
| 地圖表示 | 不適用 (host uses surfels) |
| 先驗資訊 | trained network (KITTI); odometry covariance for search region |
| 可輸出幾何 | 不適用 |
| 計算需求 | Intel i7-8700 3.2 GHz with Nvidia GeForce GTX1080 Ti 11 GB; KITTI 00 with all cues: 75 ms preprocessing, 6 ms leg feature extraction and 27 ms head matching per frame (worst case 630 ms for all candidates); Ford Campus geometry only: 10 ms, 2 ms and 24 ms (worst case 550 ms); 17 ms per scan pair with depth and normal cues versus 1.2 s for exhaustive overlap evaluation |
使用設備
原文使用的感測器、運算硬體與載具(equipment)。型號保留原文寫法,連結到設備頁中同一型號的歸併名稱;角色依原文用途分為方法輸入、資料集感測器、執行運算平台、參考或真值量測(reference or ground truth)與比較對象設備。
| 類別 | 型號(原文寫法) | 角色 | 資料集 | 原文規格 | 出處 |
|---|---|---|---|---|---|
| LiDAR | Velodyne HDL-64E | 資料集感測器 | KITTI odometry | 原文未報告 (the paper gives only processing settings: 64 x 900 range-image input and a 75 m cutoff for overlap ground truth) | (Chen et al., 2020, Sec. IV; Sec. III-C) |
| LiDAR | a different version of the Velodyne HDL-64E | 資料集感測器 | Ford Campus | 原文未報告 | (Chen et al., 2020, Sec. IV) |
| 運算硬體 | Intel i7-8700 | 執行運算平台 | 未標示 | 3.2 GHz | (Chen et al., 2020, Sec. IV-G) |
| 運算硬體 | Nvidia GeForce GTX1080 Ti | 執行運算平台 | 未標示 | 11 GB memory | (Chen et al., 2020, Sec. IV-G) |
論文圖片
只收錄原文以開放授權(open license)釋出的圖片,並依授權條件標示出處、圖號、授權與修改方式。
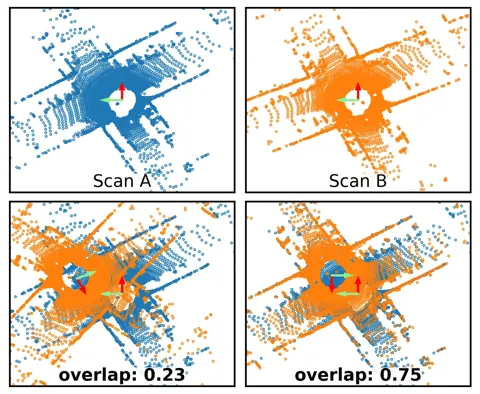
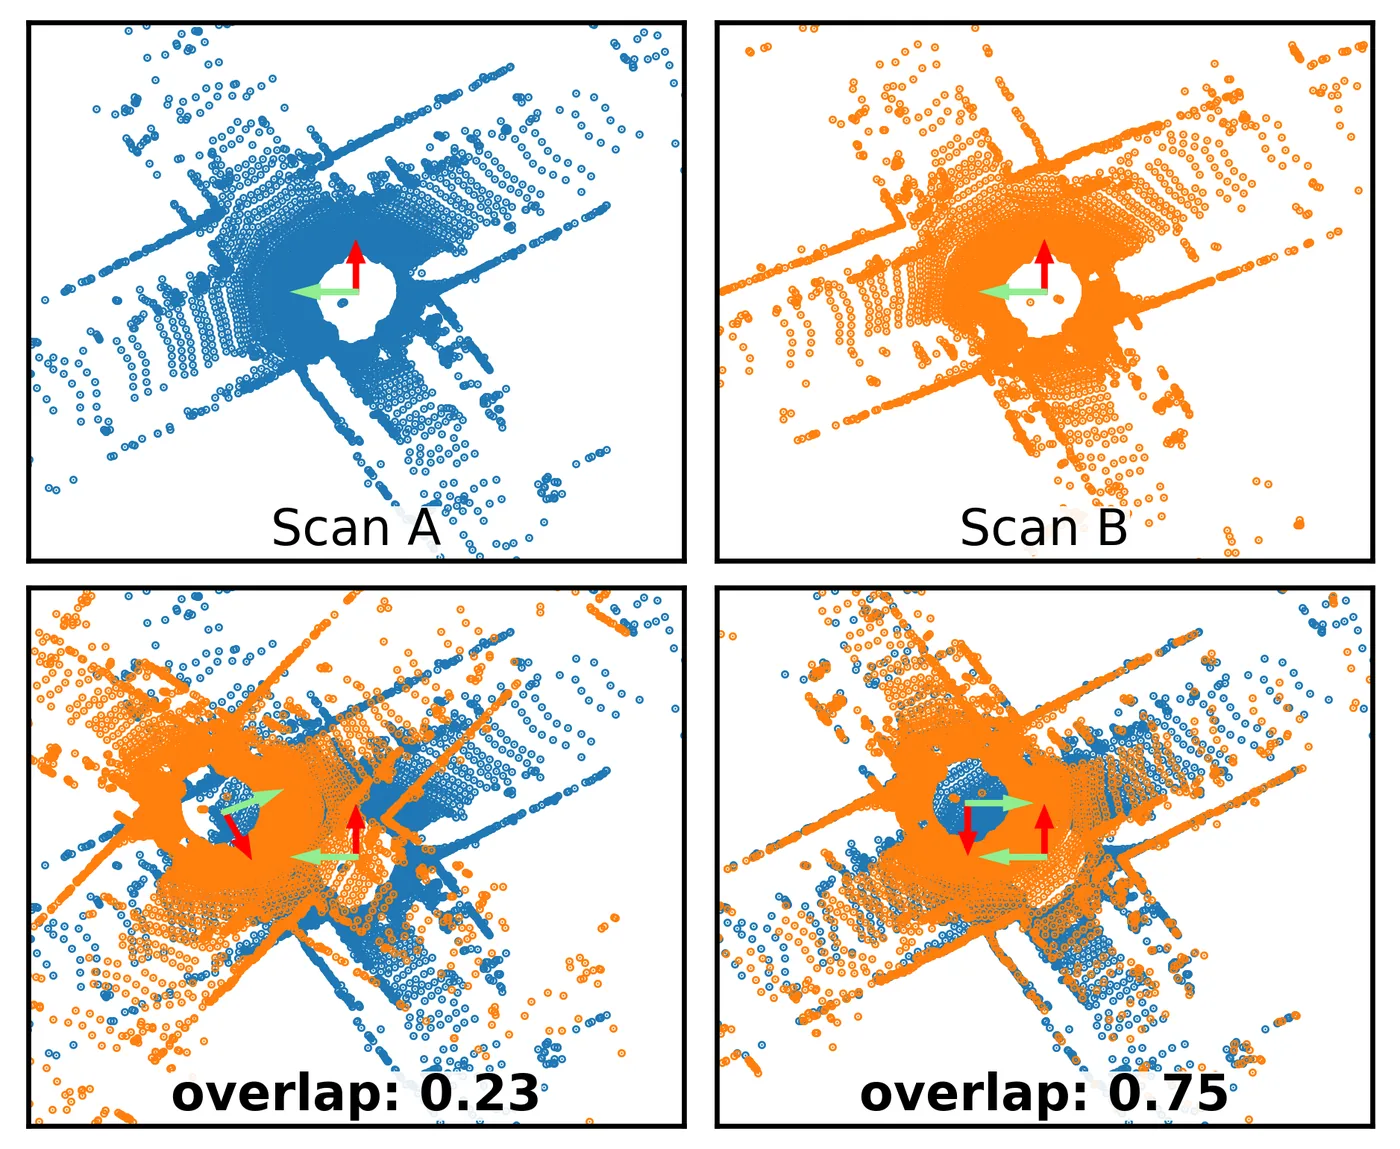
Fig. 1迴圈位置兩次掃描(藍、橙點)在不同相對轉換下的重疊示意。
出處:Chen et al., 2020,Fig. 1。授權:CC BY 4.0。原始圖檔。修改:縮小至寬度不超過 1400 px,並轉存為 WebP 格式。
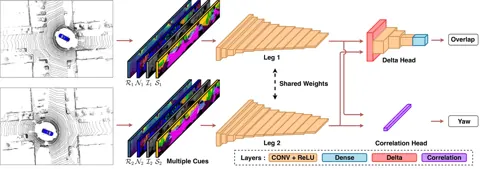
Fig. 3OverlapNet 流程:由單次掃描產生距離、法向量、強度與語意影像,經共享權重的雙腿與兩個輸出頭預測重疊率與偏航角。
出處:Chen et al., 2020,Fig. 3。授權:CC BY 4.0。原始圖檔。修改:縮小至寬度不超過 1400 px,並轉存為 WebP 格式。
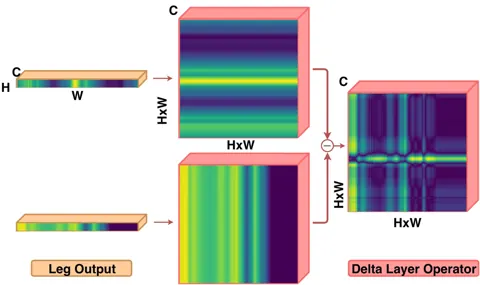
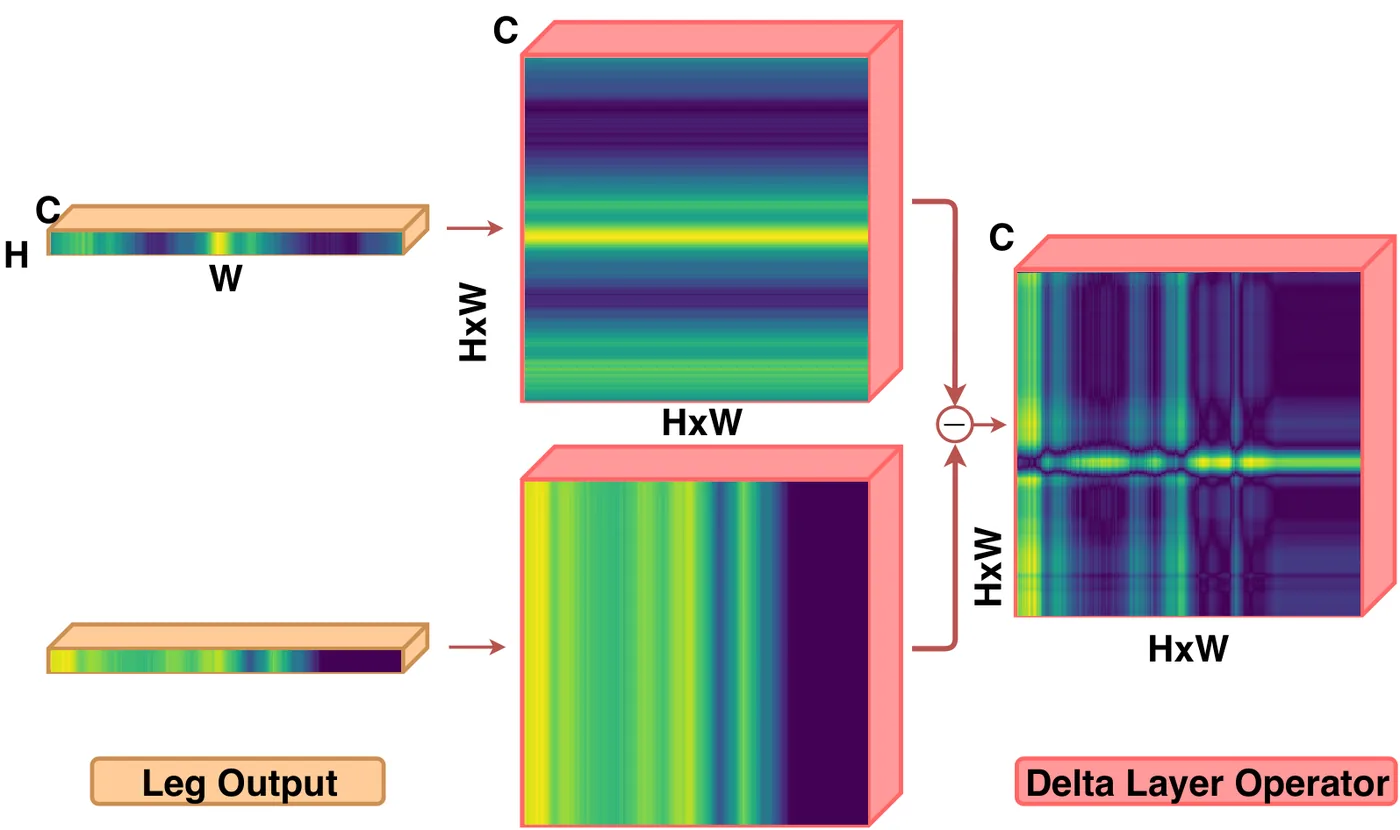
Fig. 4Delta 層以串接與轉置計算兩組特徵體所有像素差值的示意。
出處:Chen et al., 2020,Fig. 4。授權:CC BY 4.0。原始圖檔。修改:縮小至寬度不超過 1400 px,並轉存為 WebP 格式。
作者報告的優勢與限制
優勢
- Generalized to the Ford Campus dataset while trained only on KITTI (Sec. IV; abstract)
- Overlap gives a measure of loop-closure quality and yaw provides ICP initialization (Sec. IV-F, V)
- With covariance-propagated search (CovNearestOfTop10) AUC and F1 reached 0.96 on KITTI 00, versus 0.87 and 0.88 without prior (Table III)
- Yaw error mean 1.13 deg and std 3.34 deg without ICP, versus 12.67 and 15.23 deg for OREOS (Table IV)
限制
- (inference) Learned model trained on one car-mounted HDL-64E dataset (KITTI 03 to 10); only a different HDL-64E version on Ford Campus was tested, and no indoor or handheld data
- Semantic cues (RangeNet++) increase computation time; the full cue set is only available on KITTI (Sec. IV-E, IV-G)
- Without prior pose information, OREOS and LocNet++ reach slightly higher recall when more candidates are considered (Sec. IV-C)
- On Ford Campus without the covariance prior, F1 was 0.84 versus 0.85 for M2DP; the authors attribute this to no training on US roads and geometry-only input (Sec. IV-A, Table II)
營建工程相關證據
原文未報告(僅都市駕駛資料 KITTI 與 Ford Campus)
原文驗證環境:公開基準、跨場域
報告的性能數據
以下是原文作者報告的性能數值(author-reported results),不是本研究重新量測的結果。每張圖只並列同一個比較組(comparison group,同一張表、同一組實驗設定)內的方法;不同比較組之間的數值不可直接比較,也不構成排名。
本方法共出現在 6 個比較組,合計 44 筆紀錄。以下列出本方法紀錄最多的 4 組,其餘 2 組列在最後,並連到性能比較頁。
Chen et al., 2020 · Table V 本方法 16 筆
資料集與序列原文未報告 (context: KITTI odometry)
表格設定(擷取紀錄原文):Ablation on input modalities (overlap AUC and F1, yaw mean and std); dataset not named in the caption, context indicates KITTI because semantics are used (Chen et al., 2020, Table V)
overlap AUC,原文未報告 (context: KITTI odometry)
只並列這張表在相同設定下報告的方法;以「本方法:」開頭者為本頁方法。失敗、未執行與未報告以標記呈現,不是 0。
按 Tab 進入圖表後,用上下方向鍵逐一瀏覽各類別,Esc 關閉提示框;也可開啟表格檢視閱讀全部數值。
這些是 Chen et al., 2020 在此表設定下報告的數值(author-reported results),只能在同一個比較組內對照,不代表方法在其他資料或設定下的表現。
資料來源作者報告值(Chen et al., 2020, Table V)
| 方法(原文寫法) | 報告值 | 出處 |
|---|---|---|
| OverlapNet input: Depth本方法原文提出 | 0.86 ratio | (Chen et al., 2020, Table V) |
| OverlapNet input: Depth+Normals本方法原文提出 | 0.86 ratio | (Chen et al., 2020, Table V) |
| OverlapNet input: Depth+Normals+Intensity本方法原文提出 | 0.87 ratio | (Chen et al., 2020, Table V) |
| OverlapNet input: Depth+Normals+Intensity+Semantics本方法原文提出 | 0.87 ratio | (Chen et al., 2020, Table V) |
Chen et al., 2020 · Table III 本方法 12 筆
表格設定(擷取紀錄原文):Comparison with OverlapNet variants; CovNearestOfTop10 uses covariance-propagated Mahalanobis search space (prior pose information) (Chen et al., 2020, Table III)
AUC (precision-recall),KITTI odometry · 00
只並列這張表在相同設定下報告的方法;以「本方法:」開頭者為本頁方法。失敗、未執行與未報告以標記呈現,不是 0。
按 Tab 進入圖表後,用上下方向鍵逐一瀏覽各類別,Esc 關閉提示框;也可開啟表格檢視閱讀全部數值。
這些是 Chen et al., 2020 在此表設定下報告的數值(author-reported results),只能在同一個比較組內對照,不代表方法在其他資料或設定下的表現。
資料來源作者報告值(Chen et al., 2020, Table III)
| 方法(原文寫法) | 報告值 | 出處 |
|---|---|---|
| MLPOnly本方法原文提出 | 0.58 ratio | (Chen et al., 2020, Table III) |
| DeltaOnly本方法原文提出 | 0.85 ratio | (Chen et al., 2020, Table III) |
| CovNearestOfTop10本方法原文提出 | 0.96 ratio | (Chen et al., 2020, Table III) |
| Ours (AllChannel, TwoHeads)本方法原文提出 | 0.87 ratio | (Chen et al., 2020, Table III) |
Chen et al., 2020 · Text Sec.IV-G 本方法 8 筆
資料集與序列KITTI odometry · 00 (all cues incl. RangeNet++ semantics)
表格設定(擷取紀錄原文):Runtime breakdown of OverlapNet (Chen et al., 2020, Text Sec.IV-G)
input preprocessing per frame,KITTI odometry · 00 (all cues incl. RangeNet++ semantics)
這張表在此指標與資料序列只列出本方法一筆,沒有可並列的其他方法,因此不畫圖,數值與出處見下表。這是 Chen et al., 2020 在此表設定下報告的數值(author-reported results),不代表方法在其他資料或設定下的表現。
| 方法(原文寫法) | 報告值 | 出處 |
|---|---|---|
| OverlapNet本方法原文提出硬體:Intel i7-8700 3.2 GHz + Nvidia GeForce GTX1080 Ti 11 GB | 75 ms | (Chen et al., 2020, Sec. IV-G) |
Chen et al., 2020 · Table II 本方法 4 筆
表格設定(擷取紀錄原文):Loop closure detection vs state of the art; best candidate per query, 100 latest scans excluded, overlap threshold 30%; KITTI uses all cues, Ford uses geometry only (Chen et al., 2020, Table II)
AUC (precision-recall),KITTI odometry · 00
只並列這張表在相同設定下報告的方法;以「本方法:」開頭者為本頁方法。失敗、未執行與未報告以標記呈現,不是 0。
- 不適用
按 Tab 進入圖表後,用上下方向鍵逐一瀏覽各類別,Esc 關閉提示框;也可開啟表格檢視閱讀全部數值。
這些是 Chen et al., 2020 在此表設定下報告的數值(author-reported results),只能在同一個比較組內對照,不代表方法在其他資料或設定下的表現。
資料來源作者報告值(Chen et al., 2020, Table II)
| 方法(原文寫法) | 報告值 | 出處 |
|---|---|---|
| Histogram | 0.83 ratio | (Chen et al., 2020, Table II) |
| M2DP | 0.83 ratio | (Chen et al., 2020, Table II) |
| SuMa | 無數值不適用註記(擷取紀錄):不適用 (SuMa yields a single precision-recall point) | (Chen et al., 2020, Table II) |
| Ours (AllChannel, TwoHeads)本方法原文提出 | 0.87 ratio | (Chen et al., 2020, Table II) |
其他比較組
來源
Chen et al., 2020
(2020)OverlapNet: Loop Closing for LiDAR-based SLAMRobotics: Science and Systems XVI
DOI 10.15607/rss.2020.xvi.009arXiv 2105.11344程式碼
同儕審查已出版已讀全文近十年
相關版本
- 期刊延伸版:OverlapNet: a siamese network for computing LiDAR scan similarity with applications to loop closing and localization (Autonomous Robots 46(1):61-81, 2022; online 2021) 10.1007/s10514-021-09999-0
- 預印本:arXiv posting of the RSS paper (2021-05-24, after conference) https://arxiv.org/abs/2105.11344
程式碼:https://github.com/PRBonn/OverlapNet(授權:MIT (LICENSE.txt))。有公開程式碼不等於已被重現,也不代表目前版本與論文版本相同。