SA-LOAM
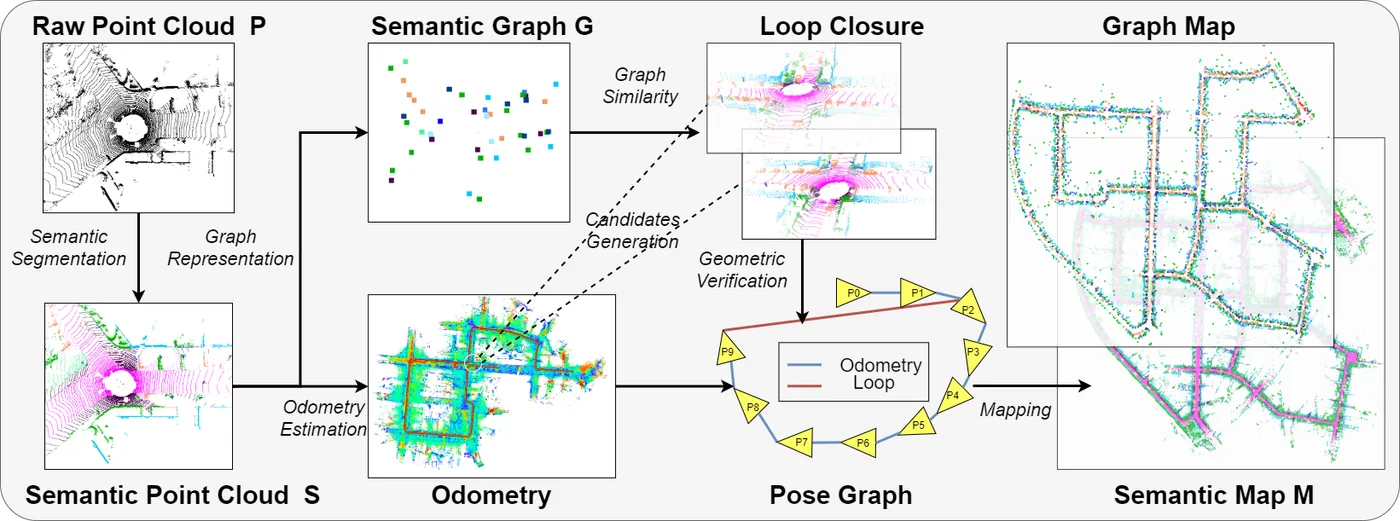
SA-LOAM 以開源的 F-LOAM 為基礎,先以預訓練的 RangeNet++ 為每個 LiDAR 點加上語意標籤,再把語意用在里程計與迴圈偵測兩處。里程計部分,邊緣與平面特徵只與相同語意的子地圖點配對,依類別分別降採樣以保留小物體,並要求地面平面法向量垂直、建物平面法向量水平,以剔除擬合不良的平面。迴圈部分,把每幀點雲聚成語意圖,以圖匹配網路評分候選,再以語意輔助 ICP 做幾何驗證,最後用 g2o 位姿圖最佳化,得到全域一致的語意地圖。
本頁內容
Semantic-aided LOAM (built on F-LOAM): RangeNet++ labels drive label-consistent edge and plane matching, class-wise downsampling and plane-orientation checks in the odometry, and a semantic-graph similarity network plus ICP verification closes loops in a g2o pose graph, yielding a globally consistent semantic map.
技術屬性
欄位內容為文獻擷取紀錄的原文用語(英文),以原文為據;「未查證」表示本研究尚未讀到該資訊,不代表該方法不具備此能力。
| 感測輸入 | 3D LiDAR only (Velodyne HDL-64E in KITTI and Ford Campus); per-point semantics from a pre-trained RangeNet++ network (Sec. IV-A) |
|---|---|
| 原文測試平台 | vehicle (KITTI; Ford Campus) |
| 狀態估計 | F-LOAM based scan-to-submap optimization of point-to-line and point-to-plane distances with semantic-related weights (set equal in the experiments); loop constraints added to a g2o pose graph (Sec. III-B; Sec. III-C; Sec. IV-A) |
| 資料關聯 | LOAM-style edge and planar features matched only to submap points of the same semantic label (k-d tree, 5 neighbours), class-specific downsampling, and plane fits kept only when ground normals are vertical and building normals horizontal; submap from the last 20 frames (Sec. III-B; Table I) |
| 時間表示 | discrete poses |
| 去畸變 | not described |
| 迴圈閉合 | candidates within an odometry-drift-dependent distance (up to 64 random candidates), similarity scored by the authors' semantic-graph matching network (score above 0.95, top 5 kept), then geometric verification by semantic-assisted ICP to a submap (Sec. III-C; Table I) |
| 全域最佳化 | pose graph optimization with g2o when a loop is detected (Sec. III-C) |
| 地圖表示 | edge and planar semantic feature submaps for odometry; global semantic point map plus a lightweight semantic graph map (at most 100 nodes of centre and label per frame) for loop search (Sec. III-A; Sec. III-C) |
| 先驗資訊 | semantic segmentation network pre-trained on SemanticKITTI (RangeNet++), 12 of 19 classes kept; graph matching network from the authors' prior work (Sec. IV-A) |
| 可輸出幾何 | trajectory and globally consistent semantic point cloud map (Figs. 1 and 4) |
| 計算需求 | Intel Core i7-9750H at 3.00 GHz, 16 GB RAM, NVIDIA GeForce GTX1080 8 GB; segmentation and graph matching run in PyTorch; runtime not reported (Sec. IV-A) |
使用設備
原文使用的感測器、運算硬體與載具(equipment)。型號保留原文寫法,連結到設備頁中同一型號的歸併名稱;角色依原文用途分為方法輸入、資料集感測器、執行運算平台、參考或真值量測(reference or ground truth)與比較對象設備。
| 類別 | 型號(原文寫法) | 角色 | 資料集 | 原文規格 | 出處 |
|---|---|---|---|---|---|
| LiDAR | Velodyne HDL-64E | 資料集感測器 | KITTI odometry | used in both KITTI and Ford Campus | (Li et al., 2021a, Sec. IV-A) |
| LiDAR | Velodyne HDL-64E | 資料集感測器 | Ford Campus Vision and Lidar Dataset | Ford sensor setting gives sparser projection images than KITTI | (Li et al., 2021a, Sec. IV-A; Sec. IV-C) |
| 運算硬體 | Intel Core i7-9750H | 執行運算平台 | 未標示 | 3.00 GHz, 16 GB RAM | (Li et al., 2021a, Sec. IV-A) |
| 運算硬體 | NVIDIA GeForce GTX1080 | 執行運算平台 | 未標示 | 8 GB GPU memory | (Li et al., 2021a, Sec. IV-A) |
論文圖片
只收錄原文以開放授權(open license)釋出的圖片,並依授權條件標示出處、圖號、授權與修改方式。
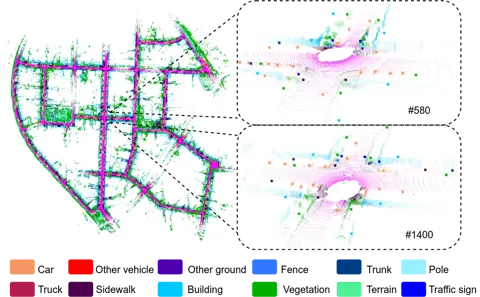
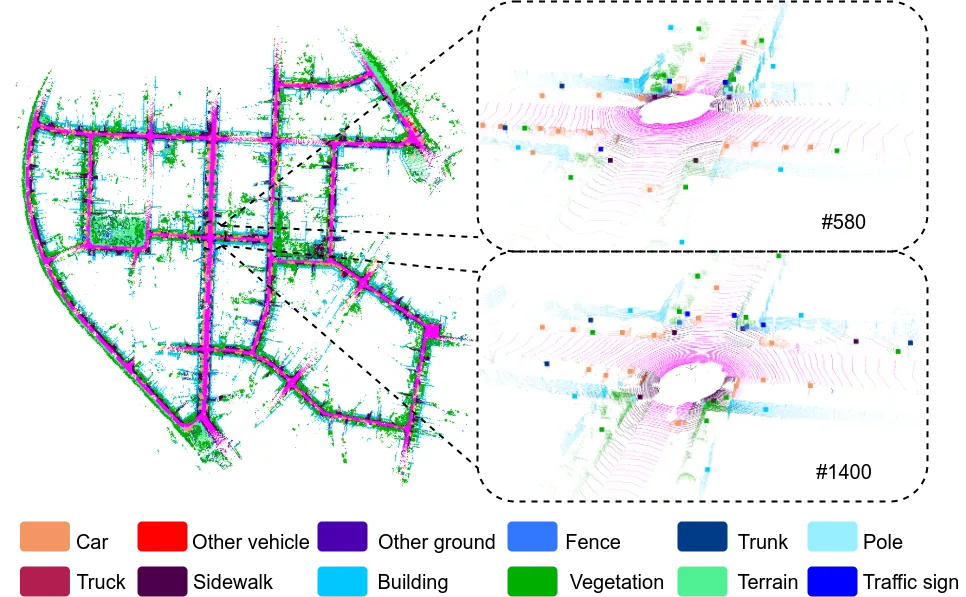
Fig. 1SA-LOAM 在 KITTI 序列 01 建立的語意地圖,不同顏色代表不同語意類別,放大點為語意圖節點,並示範一次迴圈閉合
出處:Li et al., 2021a,Fig. 1。授權:CC BY 4.0。原始圖檔。修改:轉存為 WebP 格式。
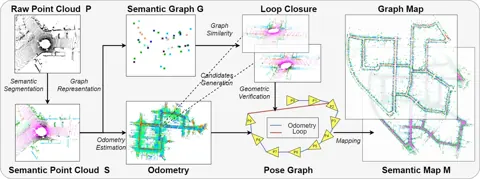
Fig. 2系統流程:原始點雲經語意分割後同時送入運動估計與迴圈偵測,偵測到迴圈時更新位姿圖並維護全域語意地圖
出處:Li et al., 2021a,Fig. 2。授權:CC BY 4.0。原始圖檔。修改:縮小至寬度不超過 1400 px,並轉存為 WebP 格式。
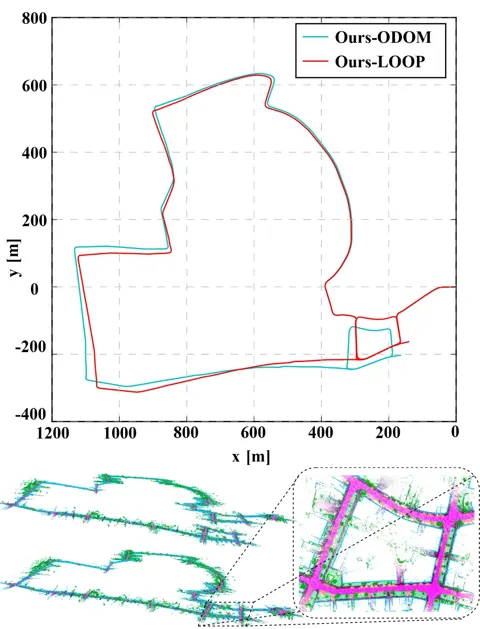
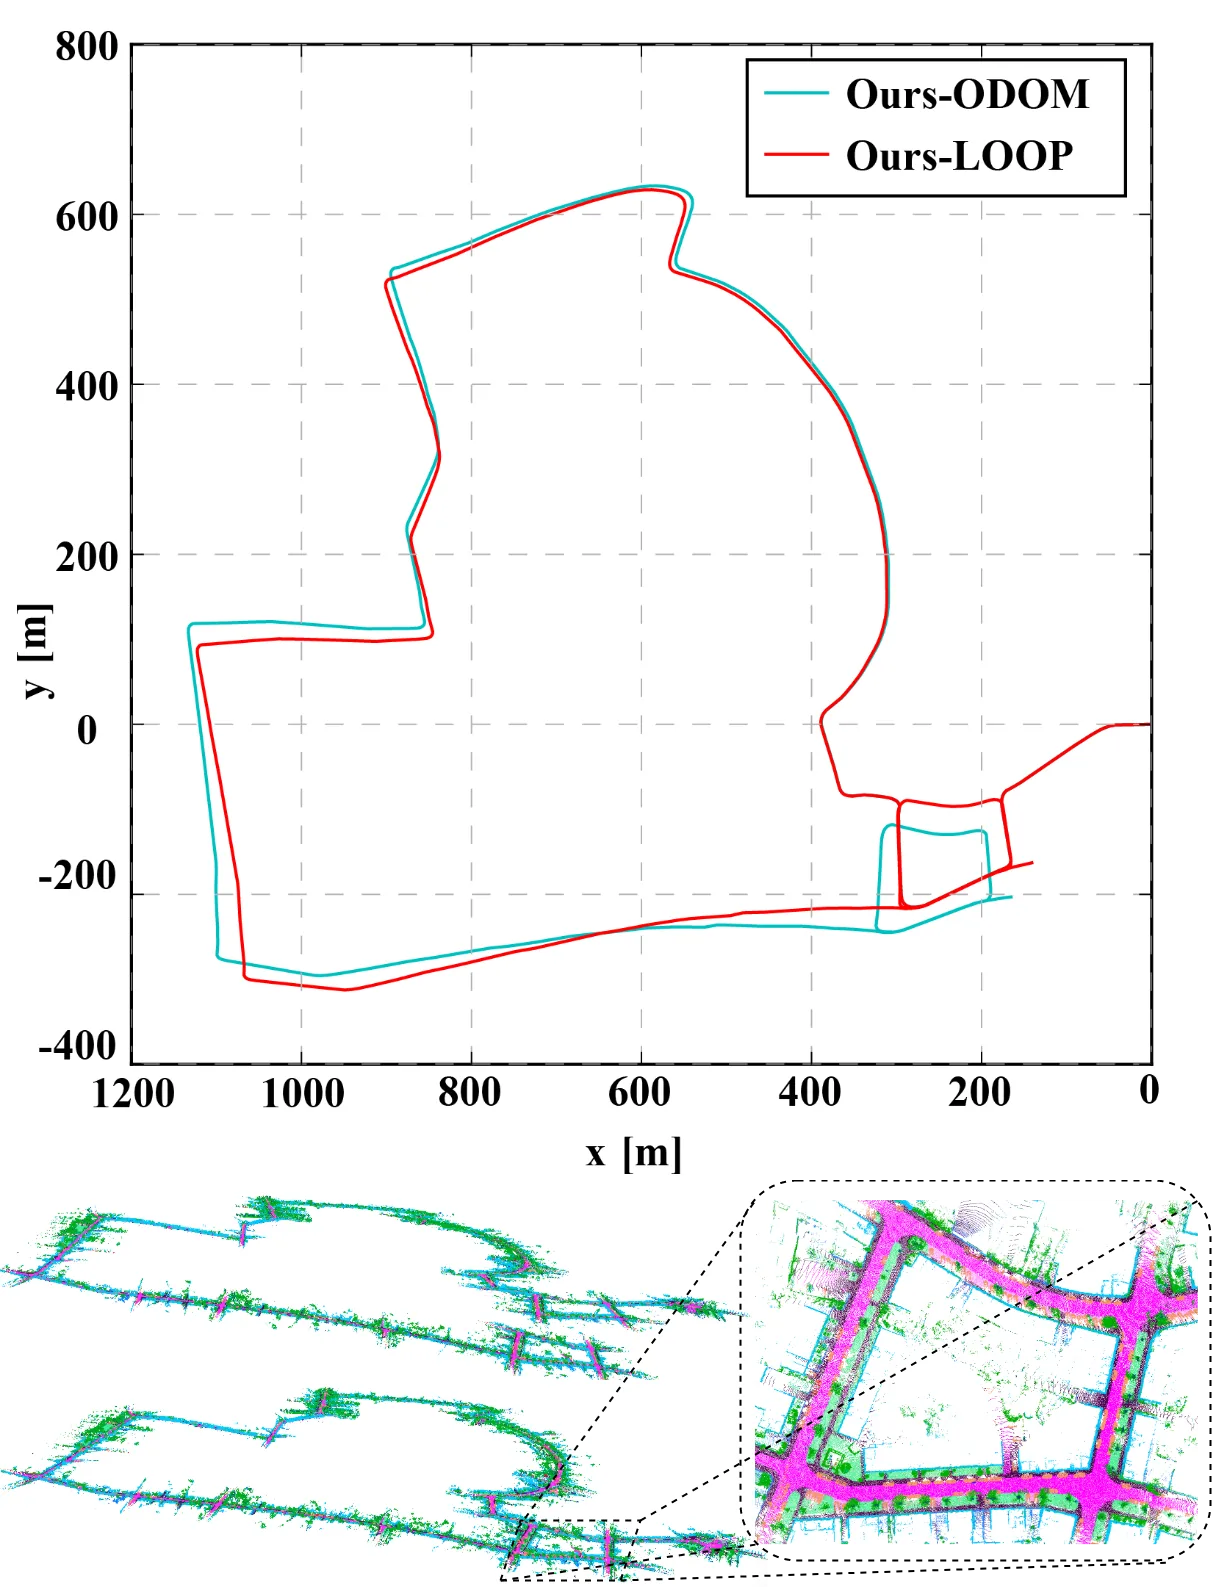
Fig. 4KITTI 測試序列 19 在迴圈閉合前後的軌跡與語意地圖
出處:Li et al., 2021a,Fig. 4。授權:CC BY 4.0。原始圖檔。修改:轉存為 WebP 格式。
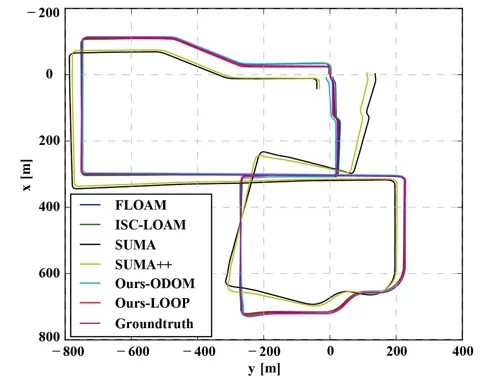
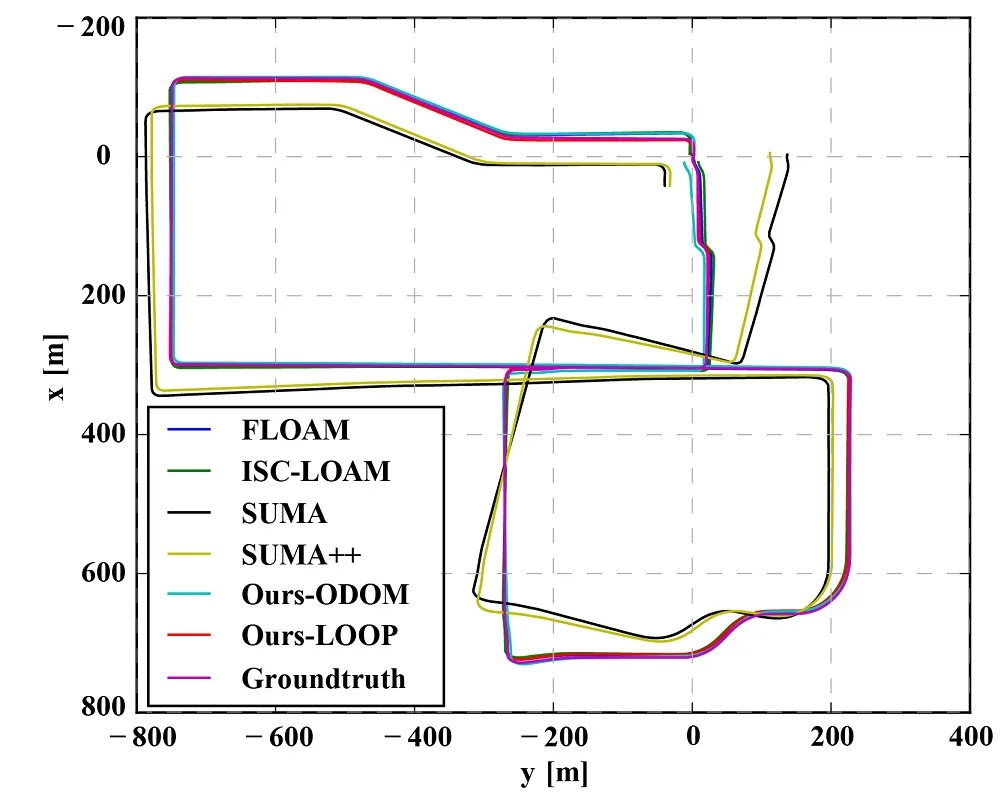
Fig. 6Ford 資料序列 02 各方法的軌跡,只有 Ours-LOOP 正確找到閉合迴圈
出處:Li et al., 2021a,Fig. 6。授權:CC BY 4.0。原始圖檔。修改:轉存為 WebP 格式。
作者報告的優勢與限制
優勢
- Average KITTI relative translational error 0.76% for both Ours-ODOM and Ours-LOOP versus 1.27% for the F-LOAM baseline (Table II)
- Loop closure lowers average KITTI ATE from 3.49 m to 2.34 m, the lowest average among ISC-LOAM, SuMa and SuMa++ (Table III)
- On the unseen Ford Campus data it has the lowest ATE on both sequences and is the only method that closes the loops on sequence 02 (Table IV; Sec. IV-C; Fig. 6)
限制
- Semantic segmentation quality drops markedly on Ford data, which inevitably affects later stages (Sec. IV-C; Fig. 7)
- Semantic weights are set equally; automatic weighting is left to future work (Sec. IV-A)
- Loop closure mainly reduces rotational error and has less effect on translational RPE (Sec. IV-B)
- Runtime is not reported although a GPU is used for segmentation and graph matching (Sec. IV-A) (inference)
- Evaluated only on driving datasets (Sec. IV)
營建工程相關證據
論文只在 KITTI 與 Ford Campus 的車載道路資料上評估,沒有施工現場資料。它依賴在 SemanticKITTI 上訓練的語意分割與道路場景類別(地面、建物等),作者也指出換到 Ford 資料時分割品質明顯下降;因此在工地這種類別與外觀差異大的場景是否適用未經驗證。以地面垂直、建物水平的平面約束剔除錯誤平面的想法,可作為室內外結構化施工場景的參考,但屬推論。
原文驗證環境:公開基準、跨場域
報告的性能數據
以下是原文作者報告的性能數值(author-reported results),不是本研究重新量測的結果。每張圖只並列同一個比較組(comparison group,同一張表、同一組實驗設定)內的方法;不同比較組之間的數值不可直接比較,也不構成排名。
本方法共出現在 3 個比較組,合計 48 筆紀錄。
Li et al., 2021a · Table II 本方法 26 筆
表格設定(擷取紀錄原文):KITTI odometry 00-10; mean relative pose error over 100-800 m trajectories (rotation deg/100m / translation %); * marks sequences with loops; LOAM values quoted from its journal paper [19]; other baselines run with open-source code (Li et al., 2021a, Table II)
relative translational error (%),KITTI odometry · 00*
只並列這張表在相同設定下報告的方法;以「本方法:」開頭者為本頁方法。失敗、未執行與未報告以標記呈現,不是 0。
按 Tab 進入圖表後,用上下方向鍵逐一瀏覽各類別,Esc 關閉提示框;也可開啟表格檢視閱讀全部數值。
這些是 Li et al., 2021a 在此表設定下報告的數值(author-reported results),只能在同一個比較組內對照,不代表方法在其他資料或設定下的表現。
資料來源作者報告值(Li et al., 2021a, Table II)
| 方法(原文寫法) | 報告值 | 出處 |
|---|---|---|
| LOAM* (from [19]) | 0.78% | (Li et al., 2021a, Table II) |
| FLOAM | 0.92% | (Li et al., 2021a, Table II) |
| ISC-LOAM | 1.02% | (Li et al., 2021a, Table II) |
| SUMA | 0.77% | (Li et al., 2021a, Table II) |
| SUMA++ | 0.65% | (Li et al., 2021a, Table II) |
| Ours-ODOM本方法原文提出 | 0.59% | (Li et al., 2021a, Table II) |
| Ours-LOOP本方法原文提出 | 0.59% | (Li et al., 2021a, Table II) |
Li et al., 2021a · Table III 本方法 16 筆
指標Absolute Trajectory Error (m)
表格設定(擷取紀錄原文):KITTI sequences with loops; absolute trajectory error (m); statistic and alignment not stated (Li et al., 2021a, Table III)
Absolute Trajectory Error (m),KITTI odometry · 00*
只並列這張表在相同設定下報告的方法;以「本方法:」開頭者為本頁方法。失敗、未執行與未報告以標記呈現,不是 0。
按 Tab 進入圖表後,用上下方向鍵逐一瀏覽各類別,Esc 關閉提示框;也可開啟表格檢視閱讀全部數值。
這些是 Li et al., 2021a 在此表設定下報告的數值(author-reported results),只能在同一個比較組內對照,不代表方法在其他資料或設定下的表現。
資料來源作者報告值(Li et al., 2021a, Table III)
| 方法(原文寫法) | 報告值 | 出處 |
|---|---|---|
| ISC-LOAM | 1.6 m | (Li et al., 2021a, Table III) |
| SUMA | 1.14 m | (Li et al., 2021a, Table III) |
| SUMA++ | 1.17 m | (Li et al., 2021a, Table III) |
| Ours-ODOM本方法原文提出 | 5.14 m | (Li et al., 2021a, Table III) |
| Ours-LOOP本方法原文提出 | 0.99 m | (Li et al., 2021a, Table III) |
Li et al., 2021a · Table IV 本方法 6 筆
指標Absolute Trajectory Error (m)
表格設定(擷取紀錄原文):Ford Campus Vision and Lidar Dataset, models and parameters tuned on KITTI only; absolute trajectory error (m); statistic and alignment not stated (Li et al., 2021a, Table IV)
Absolute Trajectory Error (m),Ford Campus Vision and Lidar Dataset · Seq01
只並列這張表在相同設定下報告的方法;以「本方法:」開頭者為本頁方法。失敗、未執行與未報告以標記呈現,不是 0。
按 Tab 進入圖表後,用上下方向鍵逐一瀏覽各類別,Esc 關閉提示框;也可開啟表格檢視閱讀全部數值。
這些是 Li et al., 2021a 在此表設定下報告的數值(author-reported results),只能在同一個比較組內對照,不代表方法在其他資料或設定下的表現。
資料來源作者報告值(Li et al., 2021a, Table IV)
| 方法(原文寫法) | 報告值 | 出處 |
|---|---|---|
| FLOAM | 1.61 m | (Li et al., 2021a, Table IV) |
| ISC-LOAM | 2.3 m | (Li et al., 2021a, Table IV) |
| SUMA | 4.45 m | (Li et al., 2021a, Table IV) |
| SUMA++ | 4.22 m | (Li et al., 2021a, Table IV) |
| Ours-ODOM本方法原文提出 | 1.35 m | (Li et al., 2021a, Table IV) |
| Ours-LOOP本方法原文提出 | 1.35 m | (Li et al., 2021a, Table IV) |
來源
Li et al., 2021a
(2021)SA-LOAM: Semantic-aided LiDAR SLAM with Loop Closure2021 IEEE International Conference on Robotics and Automation (ICRA), pp. 7627-7634
DOI 10.1109/icra48506.2021.9560884arXiv 2106.11516
同儕審查已出版已讀全文近十年
相關版本
- 預印本:SA-LOAM (arXiv v2, 'Accepted by ICRA-2021', CC BY 4.0) https://arxiv.org/abs/2106.11516