SuMa++
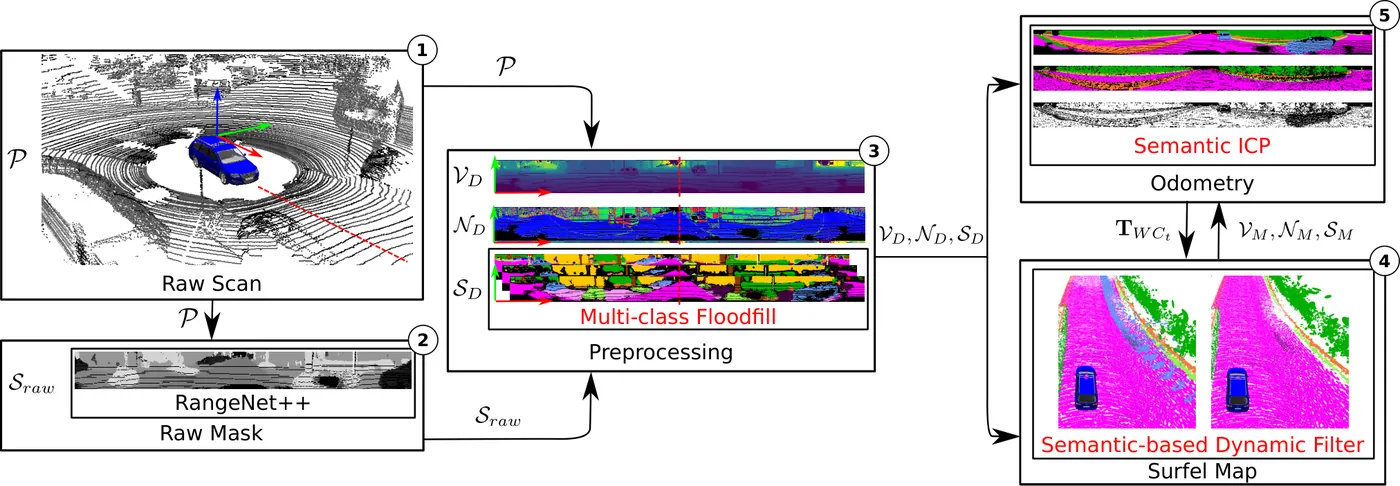
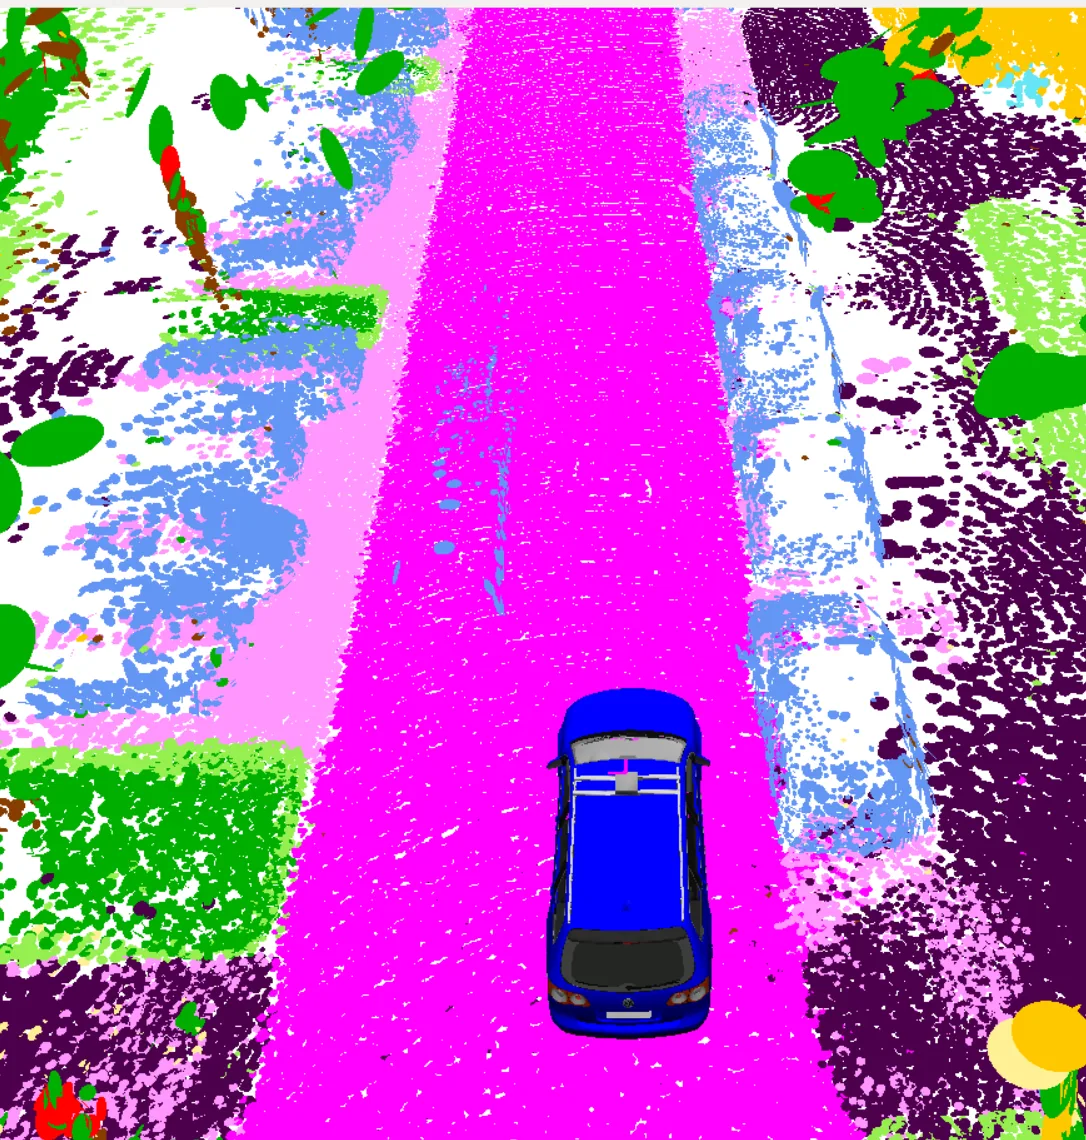
SuMa++ 在 SuMa 的面元建圖流程中加入 LiDAR 語意分割(RangeNet++,於球面投影影像上推論逐點類別),並以深度一致的洪水填充(flood-fill)修正物體邊界的標籤錯誤。更新地圖時若觀測類別與面元類別不一致,就降低該面元的穩定度,使移動物體逐漸被移除,同時保留停放車輛等靜態物體;ICP 殘差也依語意相容性加權以抑制離群值。
本頁內容
SuMa++ adds RangeNet++ point-wise semantics to SuMa, using label consistency to remove moving objects from the surfel map and to weight ICP residuals.
技術屬性
欄位內容為文獻擷取紀錄的原文用語(英文),以原文為據;「未查證」表示本研究尚未讀到該資訊,不代表該方法不具備此能力。
| 感測輸入 | 3D LiDAR (Velodyne HDL-64E S2 via KITTI) |
|---|---|
| 原文測試平台 | vehicle (KITTI) |
| 狀態估計 | SuMa frame-to-model ICP (Gauss-Newton) with residual weights combining Huber, semantic compatibility and surfel stability; SuMa pose graph (Sec. III-B, III-F) |
| 資料關聯 | projective data association as in SuMa, with per-point labels from RangeNet++ refined by depth-aware flood-fill (Sec. III-C, III-D, III-F) |
| 時間表示 | discrete scan poses |
| 去畸變 | 原文未報告 |
| 迴圈閉合 | SuMa loop closure and pose-graph optimization (Sec. III-B); semantics not used for loop closure (Sec. V) |
| 全域最佳化 | pose graph as in SuMa |
| 地圖表示 | semantically labeled surfel map; semantic inconsistency penalizes surfel stability to remove moving objects (Sec. III-C, III-E) |
| 先驗資訊 | trained semantic segmentation network (RangeNet++ trained on SemanticKITTI labels of KITTI sequences 00-10 except 08) (Sec. IV) |
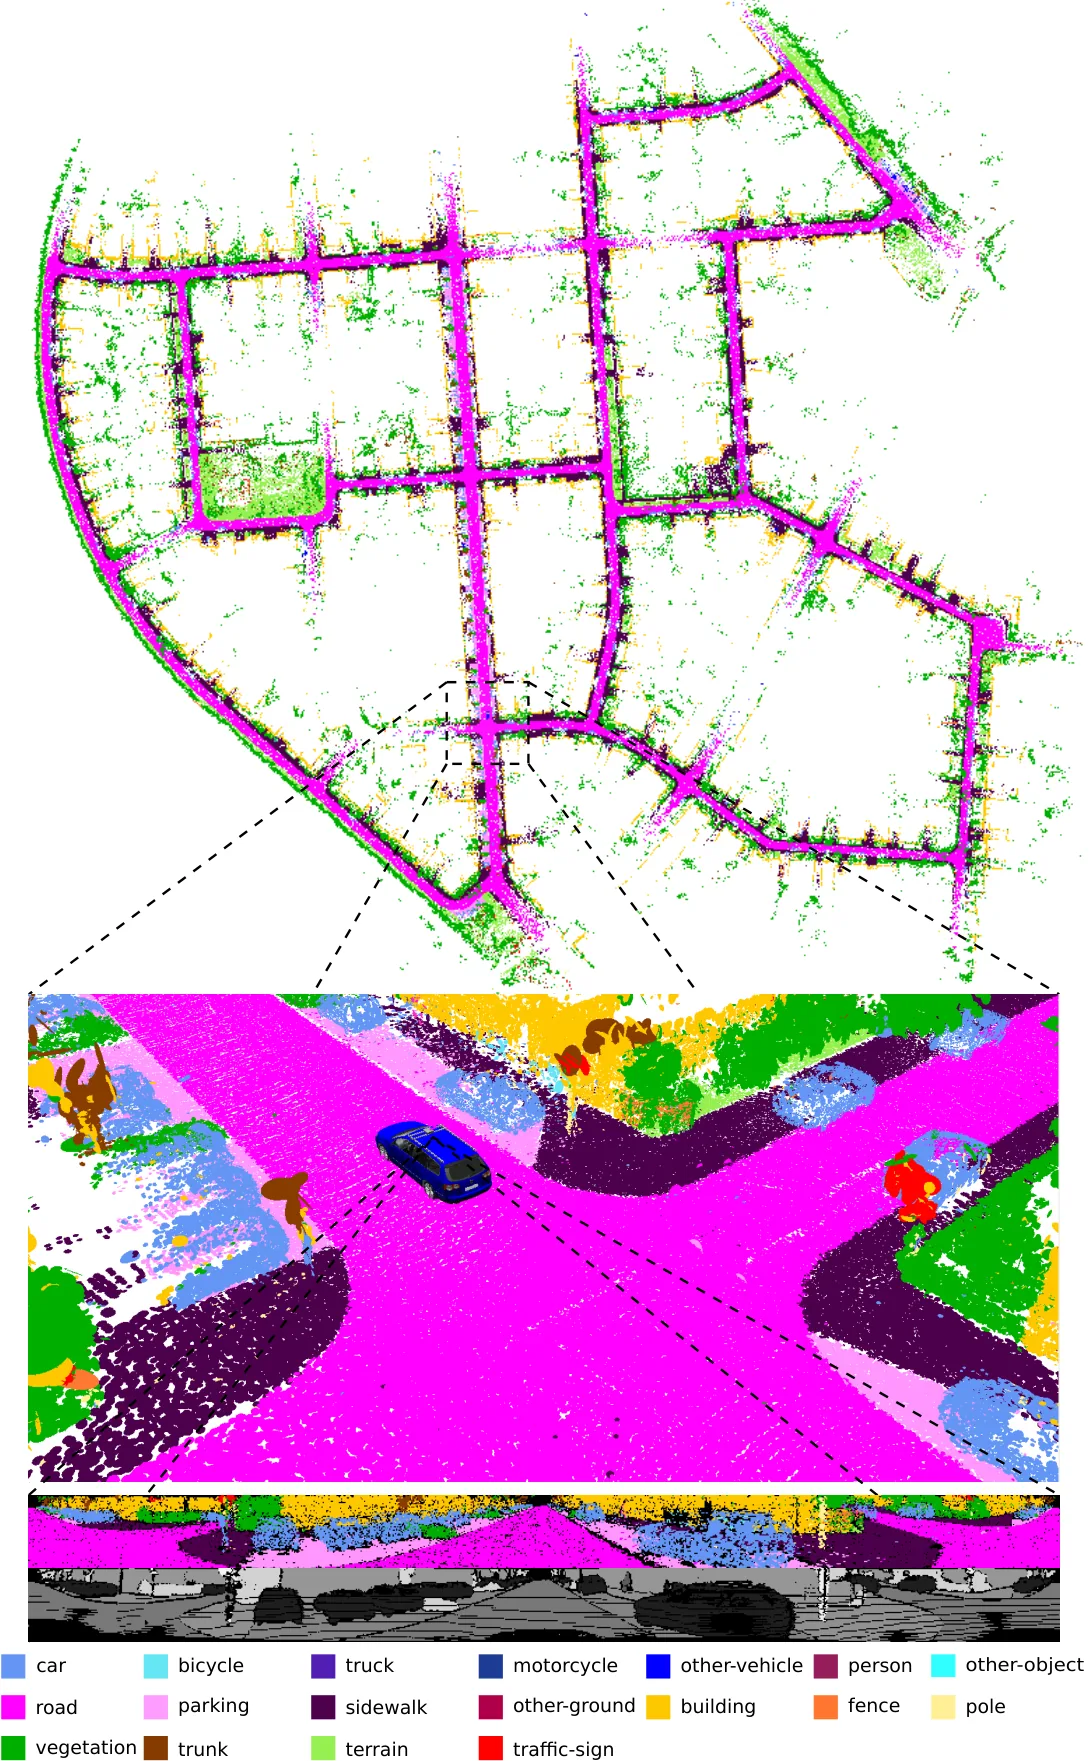
| 可輸出幾何 | semantic surfel map with point-wise labels (Sec. III-C, Fig. 4) |
| 計算需求 | Intel Xeon W-2123 (8 cores, 3.60 GHz, 16 GB RAM) with Nvidia Quadro P4000 (8 GB); RangeNet++ 75 ms and surfel mapping 48 ms on average per scan, at most 190 ms when integrating loop closures on KITTI sequence 00 (Sec. IV) |
使用設備
原文使用的感測器、運算硬體與載具(equipment)。型號保留原文寫法,連結到設備頁中同一型號的歸併名稱;角色依原文用途分為方法輸入、資料集感測器、執行運算平台、參考或真值量測(reference or ground truth)與比較對象設備。
| 類別 | 型號(原文寫法) | 角色 | 資料集 | 原文規格 | 出處 |
|---|---|---|---|---|---|
| LiDAR | Velodyne HDL-64E S2歸入:Velodyne HDL-64E | 資料集感測器 | KITTI (odometry benchmark and raw road drives) | point clouds recorded at 10 Hz (provided by KITTI) | (Chen et al., 2019, Sec. IV) |
| GNSS 接收器 | inertial navigation system with GPS referenced to a base station (model not stated) | 參考或真值量測 | KITTI | source of KITTI ground-truth poses; described as accurate but often only locally consistent | (Chen et al., 2019, Sec. IV) |
| 相機 | front-view camera (model not stated) | 資料集感測器 | KITTI raw | image shown only to illustrate the scene; not used by the method | (Chen et al., 2019, Fig. 6(c)) |
| 運算硬體 | Intel Xeon(R) W-2123 | 執行運算平台 | 未標示 | 8 cores @3.60 GHz, 16 GB RAM | (Chen et al., 2019, Sec. IV) |
| 運算硬體 | Nvidia Quadro P4000 | 執行運算平台 | 未標示 | 8 GB RAM | (Chen et al., 2019, Sec. IV) |
論文圖片
只收錄原文以開放授權(open license)釋出的圖片,並依授權條件標示出處、圖號、授權與修改方式。
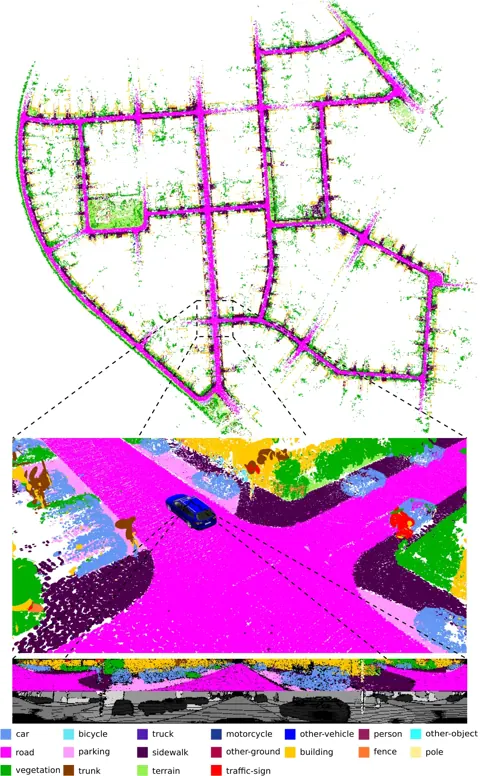
Fig. 1以 SuMa++ 只用 LiDAR 掃描建立的 KITTI 語意面元地圖,面元顏色代表語意類別
出處:Chen et al., 2019,Fig. 1。授權:CC BY 4.0。原始圖檔。修改:轉存為 WebP 格式。
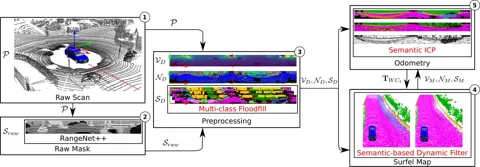
Fig. 2系統流程圖:RangeNet++ 語意分割、多類別洪水填充修正、語意動態過濾與語意 ICP 嵌入 SuMa
出處:Chen et al., 2019,Fig. 2。授權:CC BY 4.0。原始圖檔。修改:縮小至寬度不超過 1400 px,並轉存為 WebP 格式。
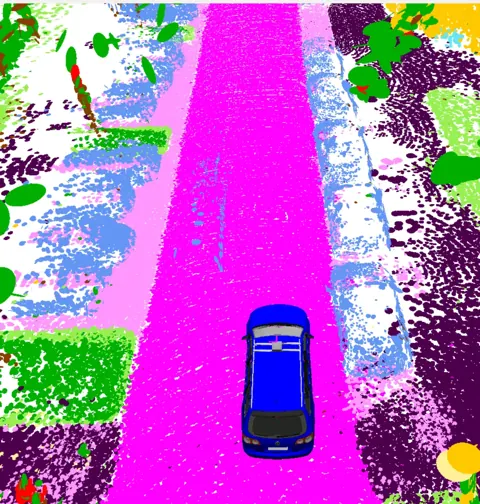
Fig. 4 (panel b)動態過濾效果比較中 SuMa++ 的面元地圖,移動車輛被移除而停放車輛保留
出處:Chen et al., 2019,Fig. 4 (panel b)。授權:CC BY 4.0。原始圖檔。修改:轉存為 WebP 格式。
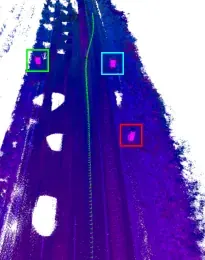
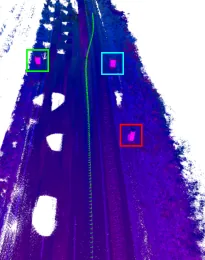
Fig. 6 (panel b)KITTI 公路序列中 SuMa++ 的點雲地圖,點色代表首次觀測時間,交通標誌一致對齊
出處:Chen et al., 2019,Fig. 6 (panel b)。授權:CC BY 4.0。原始圖檔。修改:轉存為 WebP 格式。
作者報告的優勢與限制
優勢
- KITTI training average relative errors 0.29 deg/100 m and 0.70%, vs 0.36/0.83 for SuMa (Table II)
- Consistent maps on KITTI raw road sequences with many consistently moving cars, where SuMa locks onto moving cars (Sec. IV-A, Fig. 6)
- Naively removing all movable classes (SuMa_nomovable) diverges in urban scenes, while the proposed filtering keeps parked cars (Sec. IV-B)
- KITTI raw road drives 30-41, which have no semantic labels: average 1.04 deg/100 m and 1.46 % vs SuMa 1.35 deg/100 m and 6.13 %; SuMa reached 26.8 %, 18.0 % and 15.6 % on drives 35, 40 and 41 (Table I, Sec. IV-A)
- KITTI odometry test server: 1.06 % translational error vs 1.39 % for SuMa, both 0.0032 deg/m rotational (Sec. IV-B)
限制
- Relies on a network trained with KITTI/SemanticKITTI labels (Sec. IV)
- Cannot filter dynamic objects in the first observation; many moving objects in the first scan make it fail, so all movable classes are removed during initialization (Sec. IV-C)
- Semantics not yet used for loop closure detection (Sec. V)
- On KITTI training sequences its average translational error (0.70 %) is above the IMLS-SLAM value listed in the same table (0.55 %) (Table II)
- (inference) Table II sequences 00-10 overlap the RangeNet++ training labels (00-10 except 08), so Table II is not a held-out test; the held-out evidence is Table I (unlabeled raw road drives) and the KITTI test-server result (Sec. IV-A, IV-B)
- (inference) Class taxonomy and training domain (driving scenes) may not transfer to construction-site objects such as machinery, scaffolding and material piles; not tested
營建工程相關證據
原文未報告(僅以 KITTI 驗證;(推論)工地機具與人員等動態物體會污染點雲,語意式動態過濾具參考價值,但需以工地類別重新訓練並驗證)。
原文驗證環境:公開基準
報告的性能數據
以下是原文作者報告的性能數值(author-reported results),不是本研究重新量測的結果。每張圖只並列同一個比較組(comparison group,同一張表、同一組實驗設定)內的方法;不同比較組之間的數值不可直接比較,也不構成排名。
本方法共出現在 15 個比較組,合計 116 筆紀錄。以下列出本方法紀錄最多的 4 組,其餘 11 組列在最後,並連到性能比較頁。
Chen et al., 2019 · Table I 本方法 26 筆
表格設定(擷取紀錄原文):KITTI raw road-category drives 2011_09_26_drive_0015_sync to 2011_10_03_drive_0047_sync renamed 30-41; relative errors averaged over segments of 5 to 400 m (rot deg/100 m, trans %); these drives have no semantic labels, so they are unseen by RangeNet++ (Chen et al., 2019, Table I)
relative rotational error,KITTI raw (road category) · 30
只並列這張表在相同設定下報告的方法;以「本方法:」開頭者為本頁方法。失敗、未執行與未報告以標記呈現,不是 0。
按 Tab 進入圖表後,用上下方向鍵逐一瀏覽各類別,Esc 關閉提示框;也可開啟表格檢視閱讀全部數值。
這些是 Chen et al., 2019 在此表設定下報告的數值(author-reported results),只能在同一個比較組內對照,不代表方法在其他資料或設定下的表現。
資料來源作者報告值(Chen et al., 2019, Table I)
| 方法(原文寫法) | 報告值 | 出處 |
|---|---|---|
| SuMa | 0.38 deg/100 m | (Chen et al., 2019, Table I) |
| SuMa_nomovable | 0.39 deg/100 m | (Chen et al., 2019, Table I) |
| SuMa++本方法原文提出 | 0.38 deg/100 m | (Chen et al., 2019, Table I) |
Chen et al., 2019 · Table II 本方法 24 筆
表格設定(擷取紀錄原文):KITTI odometry training sequences 00-10; relative errors averaged over 100 to 800 m segments (rot deg/100 m, trans %); asterisked sequences 00, 02, 05-09 contain loops; RangeNet++ was trained on labels of 00-10 except 08, so this table is not held out; IMLS-SLAM and LOAM rows give translation only and their source is not stated; SuMa_nomovable Average printed as 23.3/9.24, which looks swapped relative to its per-sequence values (reviewer arithmetic), recorded as printed (Chen et al., 2019, Table II)
relative translational error,KITTI odometry (training) · 00
只並列這張表在相同設定下報告的方法;以「本方法:」開頭者為本頁方法。失敗、未執行與未報告以標記呈現,不是 0。
按 Tab 進入圖表後,用上下方向鍵逐一瀏覽各類別,Esc 關閉提示框;也可開啟表格檢視閱讀全部數值。
這些是 Chen et al., 2019 在此表設定下報告的數值(author-reported results),只能在同一個比較組內對照,不代表方法在其他資料或設定下的表現。
資料來源作者報告值(Chen et al., 2019, Table II)
| 方法(原文寫法) | 報告值 | 出處 |
|---|---|---|
| SuMa | 0.68% | (Chen et al., 2019, Table II) |
| SuMa_nomovable | 58%有附註註記(擷取紀錄):(inference) diverged: authors state SuMa_nomovable diverges, particularly in urban scenes; per-sequence divergence not labelled in the paper | (Chen et al., 2019, Table II) |
| SuMa++本方法原文提出 | 0.64% | (Chen et al., 2019, Table II) |
| IMLS-SLAM [7] | 0.5% | (Chen et al., 2019, Table II) |
| LOAM [40] | 0.78% | (Chen et al., 2019, Table II) |
Pan et al., 2021 · Table II 本方法 16 筆
表格設定(擷取紀錄原文):KITTI odometry ATE [%] and ARE [deg/100m], averaged over 100-800 m segments; baseline values from original papers and KITTI leaderboard; * = with loop closure; time in s per frame (Pan et al., 2021, Table II)
ATE [%] (average translation error),KITTI odometry · 00-10 mean
只並列這張表在相同設定下報告的方法;以「本方法:」開頭者為本頁方法。失敗、未執行與未報告以標記呈現,不是 0。
按 Tab 進入圖表後,用上下方向鍵逐一瀏覽各類別,Esc 關閉提示框;也可開啟表格檢視閱讀全部數值。
這些是 Pan et al., 2021 在此表設定下報告的數值(author-reported results),只能在同一個比較組內對照,不代表方法在其他資料或設定下的表現。
資料來源作者報告值(Pan et al., 2021, Table II)
| 方法(原文寫法) | 報告值 | 出處 |
|---|---|---|
| LOAM [10] | 0.84% | (Pan et al., 2021, Table II) |
| IMLS-SLAM [11] | 0.52% | (Pan et al., 2021, Table II) |
| MC2SLAM [13] | 0.52% | (Pan et al., 2021, Table II) |
| S4-SLAM [26]* | 0.92% | (Pan et al., 2021, Table II) |
| PSF-LO [27] | 0.74% | (Pan et al., 2021, Table II) |
| SUMA++ [16]*本方法 | 0.7% | (Pan et al., 2021, Table II) |
| LiTAMIN2 [51]* | 0.85% | (Pan et al., 2021, Table II) |
| LO-Net [18] | 0.83% | (Pan et al., 2021, Table II) |
| FALO [25] | 1% | (Pan et al., 2021, Table II) |
| LoDoNet [28] | 1.27% | (Pan et al., 2021, Table II) |
| MULLS-LO(mc)原文提出 | 0.49% | (Pan et al., 2021, Table II) |
| MULLS-SLAM(mc)*原文提出 | 0.52% | (Pan et al., 2021, Table II) |
| MULLS-LO(s1)原文提出 | 2.57% | (Pan et al., 2021, Table II) |
| MULLS-SLAM(m1)*原文提出 | 0.77% | (Pan et al., 2021, Table II) |
| MULLS-SLAM(m5)*原文提出 | 0.6% | (Pan et al., 2021, Table II) |
| MULLS-SLAM(s5m5)*原文提出 | 0.61% | (Pan et al., 2021, Table II) |
Ruan et al., 2023 · Table II 本方法 13 筆
表格設定(擷取紀錄原文):KITTI odometry 00-10, relative translation error; baseline values imported from their published papers (not rerun); SLAMesh without loop closure; w/o Comb. and w/o P2Mesh are ablations (Ruan et al., 2023, Table II)
relative translation error (%),KITTI odometry · 00
只並列這張表在相同設定下報告的方法;以「本方法:」開頭者為本頁方法。失敗、未執行與未報告以標記呈現,不是 0。
按 Tab 進入圖表後,用上下方向鍵逐一瀏覽各類別,Esc 關閉提示框;也可開啟表格檢視閱讀全部數值。
這些是 Ruan et al., 2023 在此表設定下報告的數值(author-reported results),只能在同一個比較組內對照,不代表方法在其他資料或設定下的表現。
資料來源作者報告值(Ruan et al., 2023, Table II)
| 方法(原文寫法) | 報告值 | 出處 |
|---|---|---|
| LOAM | 0.78% | (Ruan et al., 2023, Table II) |
| A-LOAM | 0.97% | (Ruan et al., 2023, Table II) |
| Suma | 0.7% | (Ruan et al., 2023, Table II) |
| Suma++本方法 | 0.64% | (Ruan et al., 2023, Table II) |
| Litamin2 | 0.7% | (Ruan et al., 2023, Table II) |
| Puma | 1.46% | (Ruan et al., 2023, Table II) |
| SLAMesh (Ours) Full原文提出 | 0.77% | (Ruan et al., 2023, Table II) |
| SLAMesh w/o Comb.原文提出 | 0.96% | (Ruan et al., 2023, Table II) |
| SLAMesh w/o P2Mesh原文提出 | 0.7% | (Ruan et al., 2023, Table II) |
其他比較組
列出其餘 11 個比較組
- Li et al., 2021a · Table II
- Li et al., 2021a · Table III
- Li et al., 2021a · Table IV
- Chen et al., 2019 · Text Sec.IV
- Vizzo et al., 2023 · Table II
- Chen et al., 2019 · Text Sec.IV-B
- Zhu et al., 2025 · Table I
- Lee et al., 2025a · Table III
- Ghadimzadeh Alamdari et al., 2025 · Table 3
- Zhang et al., 2024a · Table 8
- Zhang et al., 2024a · Table 9
來源
Chen et al., 2019
(2019)SuMa++: Efficient LiDAR-based Semantic SLAM2019 IEEE/RSJ International Conference on Intelligent Robots and Systems (IROS), pp. 4530-4537
DOI 10.1109/iros40897.2019.8967704arXiv 2105.11320程式碼
同儕審查已出版已讀全文近十年查證後修正
相關版本
- 預印本:arXiv 2105.11320 (posted after the conference, comment: Accepted by IROS 2019) https://arxiv.org/abs/2105.11320
- 程式碼釋出:PRBonn/semantic_suma https://github.com/PRBonn/semantic_suma
程式碼:https://github.com/PRBonn/semantic_suma(授權:MIT (LICENSE file))。有公開程式碼不等於已被重現,也不代表目前版本與論文版本相同。