S-Graphs+
S-Graphs+ 把關鍵影格位姿圖與三維場景圖放進同一個即時最佳化的因子圖,分成關鍵影格、牆面、房間與樓層四層。前端在每個新關鍵影格以序列 RANSAC 擷取牆面平面,並用以 ESDF 建立的自由空間圖分群,再與牆面組合偵測四面牆與兩面牆房間;樓層中心則由目前所有牆面中距離最寬的一組估計。後端以新的房間對牆面單一代價因子,把房間中心與所屬牆面參數一起最佳化,並沿用 S-Graphs 的掃描匹配迴圈閉合。作者在模擬環境、多處施工中住宅工地的實測資料與公開 TIERS 資料集上,以 VLP-16 資料比較軌跡誤差,以及相對於建築圖所產生三維地圖的點雲 RMSE。
本頁內容
LiDAR graph SLAM that jointly optimizes keyframes with a four-layer situational graph (walls, rooms, floors), using free-space-cluster room segmentation and a single room-to-wall factor; evaluated on simulated and real construction-site data (map RMSE against architectural-plan maps) and on the public TIERS dataset.
技術屬性
欄位內容為文獻擷取紀錄的原文用語(英文),以原文為據;「未查證」表示本研究尚未讀到該資訊,不代表該方法不具備此能力。
| 感測輸入 | 3D LiDAR (VLP-16 data used in all datasets, Sec. VI-A)、Odometry input: robot encoders on the in-house real data (the in-house platform is a legged robot, Fig. 1); LiDAR odometry (VGICP or FLOAM) on simulated and TIERS data |
|---|---|
| 原文測試平台 | legged robot on the in-house construction-site data (Fig. 1; model not reported)、simulation、TIERS dataset moving platform (platform type not described in the paper) |
| 狀態估計 | Four-layer factor graph (keyframes, wall planes, rooms, floors) jointly optimized in real time; keyframes linked by pairwise odometry, walls by pose-plane constraints, rooms by a single room-to-wall cost per room (four-wall and two-wall variants), floors by floor-to-room relative-distance factors, plus a drift node between odometry and map frames (Sec. III, V) |
| 資料關聯 | Wall planes extracted from each new keyframe cloud by sequential RANSAC, converted to closest-point form in the map frame and matched to mapped planes by Mahalanobis distance (threshold 0.35 m); rooms matched by L2 distance of centres with wall-id checks (threshold 1 m); loop closures by scan matching as in S-Graphs (Sec. IV, VI-A) |
| 時間表示 | discrete keyframes selected at distance-time intervals |
| 去畸變 | 原文未報告 |
| 迴圈閉合 | scan-matching loop closure module inherited from S-Graphs (Sec. III) |
| 全域最佳化 | joint real-time optimization of keyframes, walls, rooms and floors in one factor graph (Sec. V) |
| 地圖表示 | keyframe point clouds with a 3D scene graph of wall planes, four-wall and two-wall rooms and floor centres; local ESDF (clearing radius 10 m) and sparse free-space graph used only for room segmentation (Sec. IV-B, VI-A) |
| 先驗資訊 | none for estimation; architectural plans used only to build the evaluation reference |
| 可輸出幾何 | 3D point-cloud map plus the four-layer situational graph; map evaluated by point-cloud RMSE against a 3D map generated from architectural plans (Table II) |
| 計算需求 | Per-module mean times on construction-site sequences: plane segmentation 44.8 to 91.8 ms, back-end 74.0 to 263.1 ms, real time kept for sequences up to about 17 min (Table III); hardware not reported |
使用設備
原文使用的感測器、運算硬體與載具(equipment)。型號保留原文寫法,連結到設備頁中同一型號的歸併名稱;角色依原文用途分為方法輸入、資料集感測器、執行運算平台、參考或真值量測(reference or ground truth)與比較對象設備。
| 類別 | 型號(原文寫法) | 角色 | 資料集 | 原文規格 | 出處 |
|---|---|---|---|---|---|
| LiDAR | VLP-16歸入:Velodyne VLP-16 | 方法輸入 | 未標示 | used for all datasets; ESDF resolution derived from LiDAR resolution: 0.18 m vertical, 0.03 m horizontal | (Bavle et al., 2023, Sec. VI-A) |
| LiDAR | VLP-16歸入:Velodyne VLP-16 | 資料集感測器 | TIERS LiDARs dataset | TIERS multi-modal LiDAR dataset recorded by a moving platform; sequences T6-T8 small room, T10-T11 larger hallway | (Bavle et al., 2023, Sec. VI-A) |
| 輪式或腿式里程計 | robot encoders (model not reported) | 方法輸入 | 未標示 | odometry source for all in-house real sequences | (Bavle et al., 2023, Sec. VI-A (In-House Dataset)) |
| 載具平台 | legged robot (model not reported) | 方法輸入 | 未標示 | robot shown navigating a construction site of four adjacent houses | (Bavle et al., 2023, Fig. 1 caption) |
論文圖片
只收錄原文以開放授權(open license)釋出的圖片,並依授權條件標示出處、圖號、授權與修改方式。
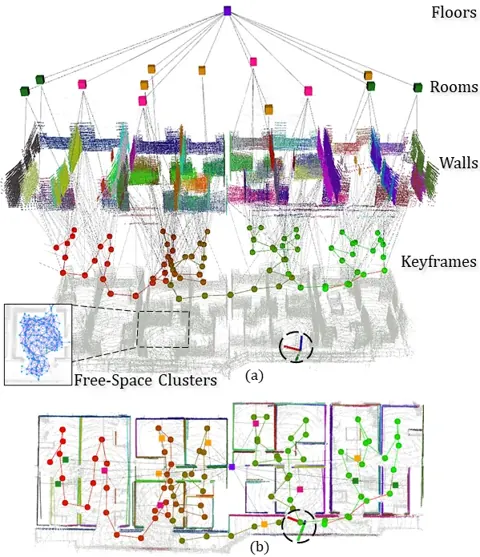
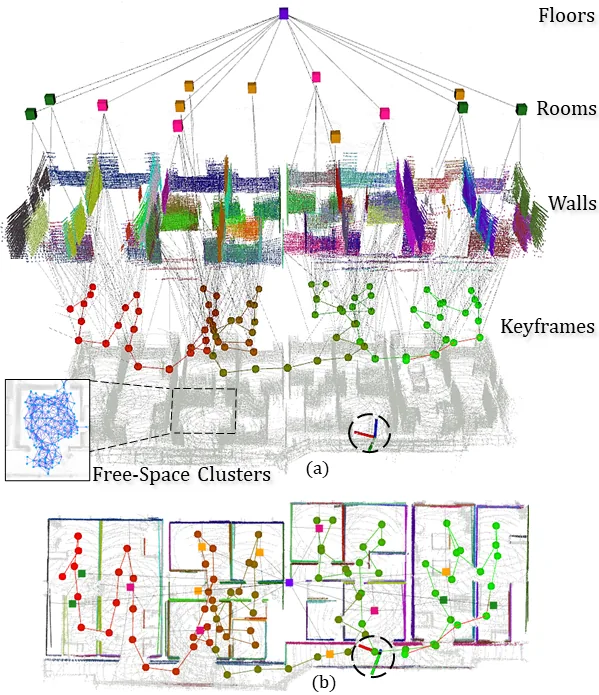
Fig. 1腿式機器人(黑圈處)在四棟相連住宅施工現場建立的 S-Graph+:(a) 四層可最佳化圖的三維視圖,放大處為房間分割所用的自由空間群集;(b) 同一圖的俯視圖
出處:Bavle et al., 2023,Fig. 1。授權:CC BY 4.0。原始圖檔。修改:轉存為 WebP 格式。
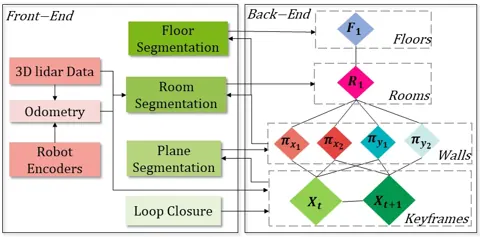
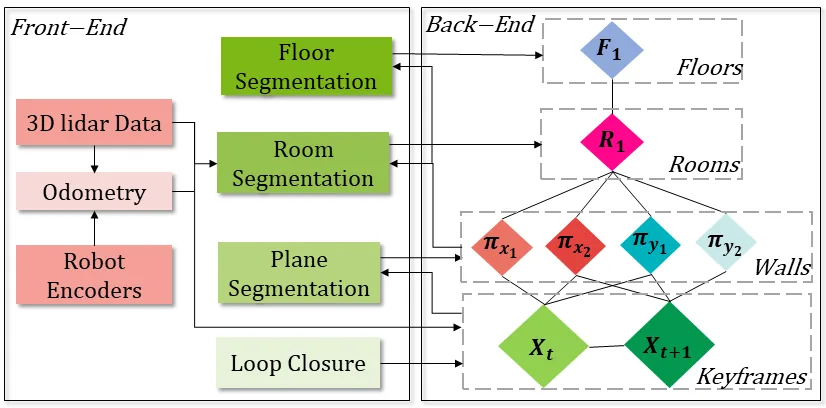
Fig. 2S-Graphs+ 系統架構:LiDAR 與里程計輸入、牆面、房間、樓層分割與迴圈閉合前端,以及四層因子圖後端
出處:Bavle et al., 2023,Fig. 2。授權:CC BY 4.0。原始圖檔。修改:轉存為 WebP 格式。
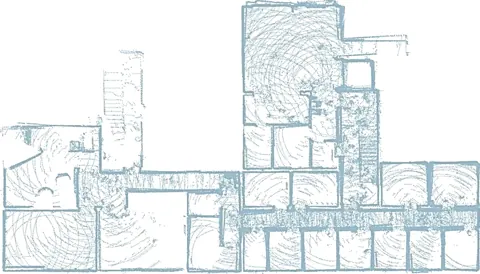
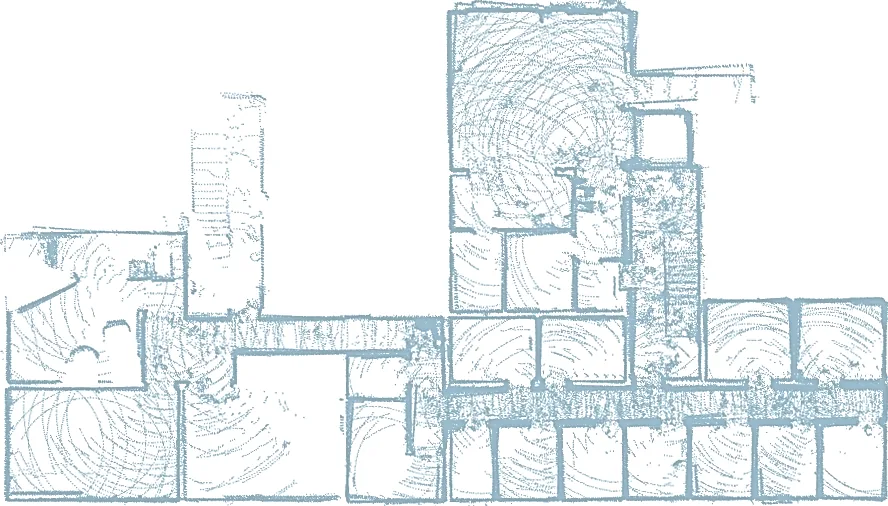
Fig. 4 (a)施工現場地下室序列 C4F0 由 S-Graphs+ 估計的地圖俯視圖(原圖另含 HDL-SLAM、ALOAM、FLOAM 比較)
出處:Bavle et al., 2023,Fig. 4 (a)。授權:CC BY 4.0。原始圖檔。修改:轉存為 WebP 格式。
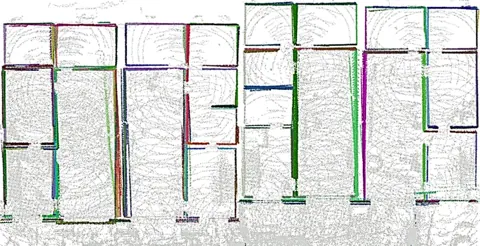
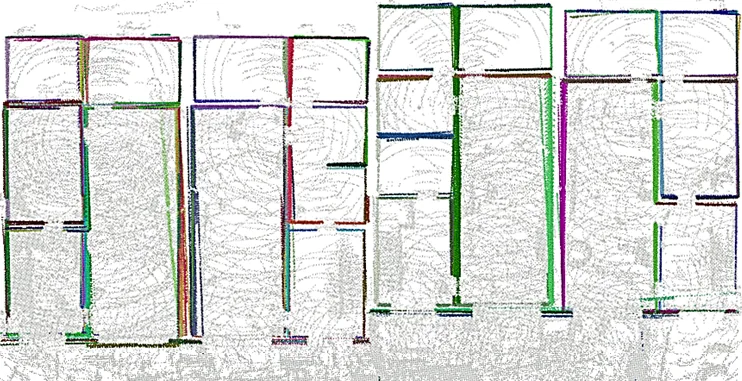
Fig. 5 (a)施工現場序列 C2F0 由 S-Graphs+ 建立的點雲地圖(原圖另含 S-Graphs 對照)
出處:Bavle et al., 2023,Fig. 5 (a)。授權:CC BY 4.0。原始圖檔。修改:轉存為 WebP 格式。
作者報告的優勢與限制
優勢
- Average accuracy improvement of 10.67% over the second-best method across simulated and real experiments (Abstract; Sec. VII)
- Lowest average point-cloud RMSE on the real construction-site sequences (20.9 x 10^-2 m), 5.93% better than the second-best baseline (Table II; Sec. VI-B)
- Room-detection recall substantially higher than S-Graphs, adding constraints that improve accuracy in complex layouts such as C2F1 (Fig. 7; Sec. VI-B)
- All modules kept real-time performance on sequences up to about 17 min (Table III; Sec. VI-B)
- Same empirically chosen thresholds were used in all experiments without fine-tuning (Sec. VI-A)
限制
- The floor layer mostly adds semantics without significantly improving accuracy and was not ablated (Sec. VI-A)
- Back-end computation time grows with sequence length as the graph grows (Sec. VI-B)
- Validation on buildings with several floors and faster hierarchical optimization are left to future work (Sec. VII)
- The map reference is a 3D map generated from architectural plans, not an as-built survey; C4F0 had no plan and was assessed only qualitatively (Sec. VI-A)
營建工程相關證據
作者在多處施工中住宅工地(單棟住宅兩層、四棟相連住宅三層、兩棟相連住宅兩層與一處地下室儲藏區)以機器人蒐集 VLP-16 資料,並以建築圖產生的三維地圖作為點雲 RMSE 參考(Sec. VI-A、Table II)。此參考代表設計狀態而非竣工量測,所以數值同時包含 SLAM 誤差與現場偏離圖面的部分(推論)。
原文驗證環境:模擬、施工中工地、公開基準、跨場域
報告的性能數據
以下是原文作者報告的性能數值(author-reported results),不是本研究重新量測的結果。每張圖只並列同一個比較組(comparison group,同一張表、同一組實驗設定)內的方法;不同比較組之間的數值不可直接比較,也不構成排名。
本方法共出現在 3 個比較組,合計 72 筆紀錄。
Bavle et al., 2023 · Table III 本方法 28 筆
表格設定(擷取紀錄原文):Mean computation time per S-Graphs+ module on the in-house construction-site sequences; sequence length 487 s for C1F1 (Bavle et al., 2023, Table III)
Computation Time (mean) [ms], module: Plane Segmentation,in-house construction-site dataset (VLP-16) · C1F1
這張表在此指標與資料序列只列出本方法一筆,沒有可並列的其他方法,因此不畫圖,數值與出處見下表。這是 Bavle et al., 2023 在此表設定下報告的數值(author-reported results),不代表方法在其他資料或設定下的表現。
| 方法(原文寫法) | 報告值 | 出處 |
|---|---|---|
| S-Graphs+ (Plane Segmentation)本方法原文提出 | 91.8 ms | (Bavle et al., 2023, Table III (arXiv v3)) |
Bavle et al., 2023 · Table II 本方法 24 筆
指標Point Cloud RMSE [m x 10^-2] against architectural-plan 3D map
表格設定(擷取紀錄原文):In-house real sequences on ongoing construction sites (C1: single house, C2: four combined houses, C3: two combined houses); all methods use odometry from robot encoders; RMSE of the estimated 3D map against the 3D map generated from the architectural plan, values in m x 10^-2; '-' marks an unsuccessful run; Avg as printed in the table (Bavle et al., 2023, Table II)
Point Cloud RMSE [m x 10^-2] against architectural-plan 3D map,in-house construction-site dataset (VLP-16) · C1F1
只並列這張表在相同設定下報告的方法;以「本方法:」開頭者為本頁方法。失敗、未執行與未報告以標記呈現,不是 0。
- 失敗
按 Tab 進入圖表後,用上下方向鍵逐一瀏覽各類別,Esc 關閉提示框;也可開啟表格檢視閱讀全部數值。
這些是 Bavle et al., 2023 在此表設定下報告的數值(author-reported results),只能在同一個比較組內對照,不代表方法在其他資料或設定下的表現。
資料來源作者報告值(Bavle et al., 2023, Table II)
| 方法(原文寫法) | 報告值 | 出處 |
|---|---|---|
| HDL-SLAM [11] | 33.5 cm | (Bavle et al., 2023, Table II (arXiv v3)) |
| ALOAM [6] | 52.6 cm | (Bavle et al., 2023, Table II (arXiv v3)) |
| MLOAM [10] | 45 cm | (Bavle et al., 2023, Table II (arXiv v3)) |
| FLOAM [7] | 68.5 cm | (Bavle et al., 2023, Table II (arXiv v3)) |
| LeGO-LOAM [8] | 無數值失敗註記(擷取紀錄):failed (reported as unsuccessful run '-') | (Bavle et al., 2023, Table II (arXiv v3)) |
| S-Graphs [9] | 33.1 cm | (Bavle et al., 2023, Table II (arXiv v3)) |
| S-Graphs+ w. OR本方法原文提出 | 32.4 cm | (Bavle et al., 2023, Table II (arXiv v3)) |
| S-Graphs+ w. OF本方法原文提出 | 32.8 cm | (Bavle et al., 2023, Table II (arXiv v3)) |
| S-Graphs+ (ours)本方法原文提出 | 32.9 cm | (Bavle et al., 2023, Table II (arXiv v3)) |
Bavle et al., 2023 · Table I 本方法 20 筆
指標Absolute Trajectory Error (ATE) [m x 10^-2]
表格設定(擷取紀錄原文):Simulated experiments: C1F0 and C1F2 from 3D meshes of two floors of real architectural plans, SE1 to SE3 generic simulated indoor layouts; odometry from LiDAR only; ATE against simulator ground truth, values given in m x 10^-2; '-' marks an unsuccessful run (Bavle et al., 2023, Table I)
Absolute Trajectory Error (ATE) [m x 10^-2],in-house simulated data (VLP-16 simulated) · C1F0
只並列這張表在相同設定下報告的方法;以「本方法:」開頭者為本頁方法。失敗、未執行與未報告以標記呈現,不是 0。
- 失敗
按 Tab 進入圖表後,用上下方向鍵逐一瀏覽各類別,Esc 關閉提示框;也可開啟表格檢視閱讀全部數值。
這些是 Bavle et al., 2023 在此表設定下報告的數值(author-reported results),只能在同一個比較組內對照,不代表方法在其他資料或設定下的表現。
資料來源作者報告值(Bavle et al., 2023, Table I)
| 方法(原文寫法) | 報告值 | 出處 |
|---|---|---|
| HDL-SLAM [11] (VGICP [26] odometry) | 9.42 cm | (Bavle et al., 2023, Table I (arXiv v3)) |
| ALOAM [6] (ALOAM odometry) | 9.9 cm | (Bavle et al., 2023, Table I (arXiv v3)) |
| MLOAM [10] (MLOAM odometry) | 無數值失敗註記(擷取紀錄):failed (reported as unsuccessful run '-') | (Bavle et al., 2023, Table I (arXiv v3)) |
| FLOAM [7] (FLOAM odometry) | 11.7 cm | (Bavle et al., 2023, Table I (arXiv v3)) |
| LeGO-LOAM [8] (LeGO-LOAM odometry) | 無數值失敗註記(擷取紀錄):failed (reported as unsuccessful run '-') | (Bavle et al., 2023, Table I (arXiv v3)) |
| S-Graphs [9] (VGICP odometry) | 5.09 cm | (Bavle et al., 2023, Table I (arXiv v3)) |
| S-Graphs+ w. OR (VGICP odometry; old room detection, new room-to-wall factors)本方法原文提出 | 4.95 cm | (Bavle et al., 2023, Table I (arXiv v3)) |
| S-Graphs+ w. OF (VGICP odometry; new room detection, old factors)本方法原文提出 | 5.31 cm | (Bavle et al., 2023, Table I (arXiv v3)) |
| S-Graphs+ (ours) (VGICP odometry)本方法原文提出 | 4.47 cm | (Bavle et al., 2023, Table I (arXiv v3)) |
| S-Graphs+ (ours) (FLOAM odometry)本方法原文提出 | 5.94 cm | (Bavle et al., 2023, Table I (arXiv v3)) |
來源
Bavle et al., 2023
(2023)S-Graphs+: Real-Time Localization and Mapping Leveraging Hierarchical RepresentationsIEEE Robotics and Automation Letters, 8(8):4927-4934
DOI 10.1109/lra.2023.3290512arXiv 2212.11770程式碼
同儕審查已出版已讀全文近十年查證後修正
相關版本
- 預印本:S-Graphs+: Real-time Localization and Mapping leveraging Hierarchical Representations (arXiv v1 to v3) https://arxiv.org/abs/2212.11770
- predecessor:Situational Graphs for Robot Navigation in Structured Indoor Environments (S-Graphs), RA-L 7(4):9107-9114, 2022 https://doi.org/10.1109/LRA.2022.3189785
- 程式碼釋出:snt-arg/lidar_situational_graphs (shared S-Graphs lineage repository) https://github.com/snt-arg/lidar_situational_graphs
程式碼:https://github.com/snt-arg/lidar_situational_graphs(授權:GPL-3.0 (LICENSE file on master branch checked 2026-09-25; paper states release as a docker file))。有公開程式碼不等於已被重現,也不代表目前版本與論文版本相同。